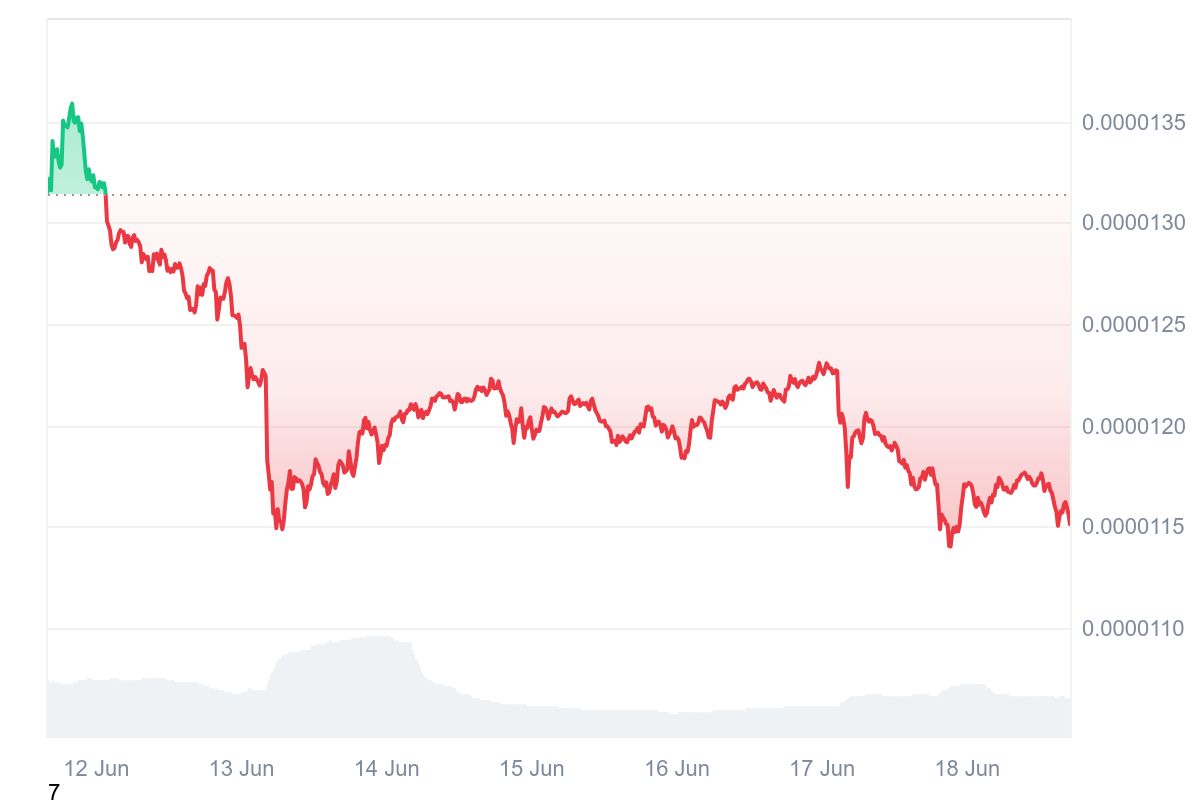
When the market opened for the week, Shiba Inu (SHIB) was trading hands at an opening market price of $0.00001314. The memecoin was met with intense selling pressure as the week progressed. The token crashed drastically and reached its weekly low price of $0.00001149 last Friday.
Although the memecoin buyers tried to push the price past the $0.0000125 resistance level, the bears in the market were way too strong. At the time of publication, the token is trading at $0.00001151, as it heads towards marking a what looks like a new lower low. During the last 7 days, the token lost more than 13% while its trading volume dropped by 6.5% to $148 million.
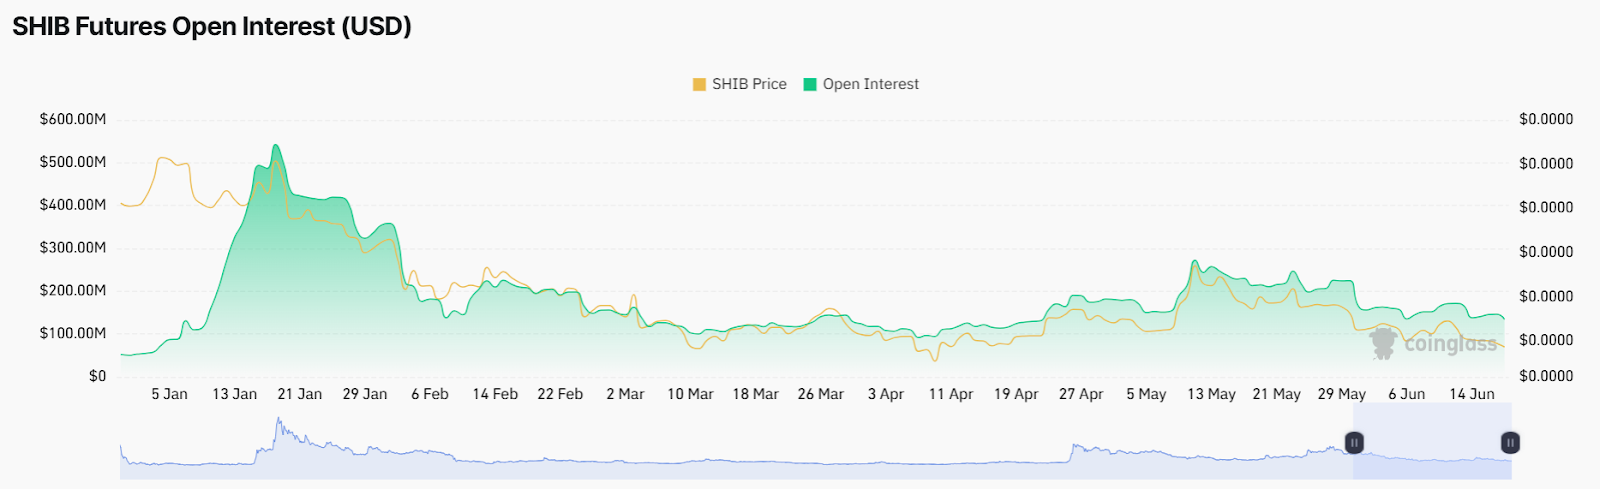
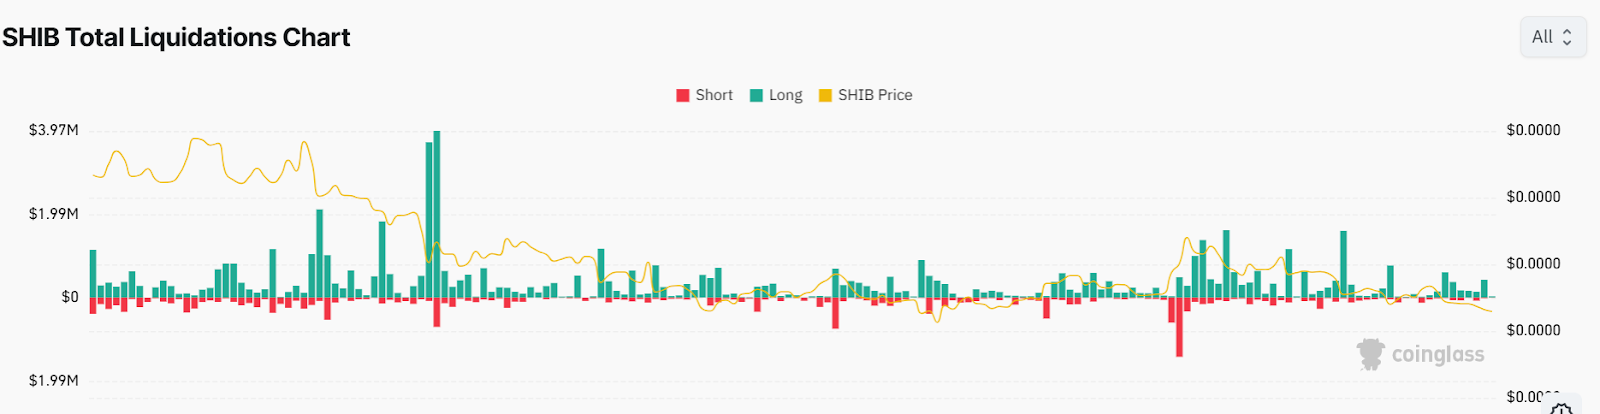
According to Coinglass, the memecoin’s open interest (OI) fell from $171 million to $134 million during the last 7 days. The open interest shows the total number of futures or option contracts that have not been settled. When the OI reduces, it shows weakening momentum and profit taking.
Shiba Inu’s long liquidations increase. What’s happening?
The total long liquidations increased from $134K to $ 425 K. When the long liquidations increase, it shows that buyers who took long positions on the token are forced to exit as the prices are falling too steeply. Contrastingly, the long-short ratio seems to have improved as it has increased to 0.931. Hence, maybe the bearish phase could be fading.
SHIB’s Cup and Handle could end the bearish trend
When we look at the technical analysis for SHIB, there is a cup and handle pattern emerging on the daily chart. The pattern is almost complete, and there could be a shift in the market sentiment, as the cup and handle pattern is a bullish reversal pattern that starts once the token has fallen to its lowest point.
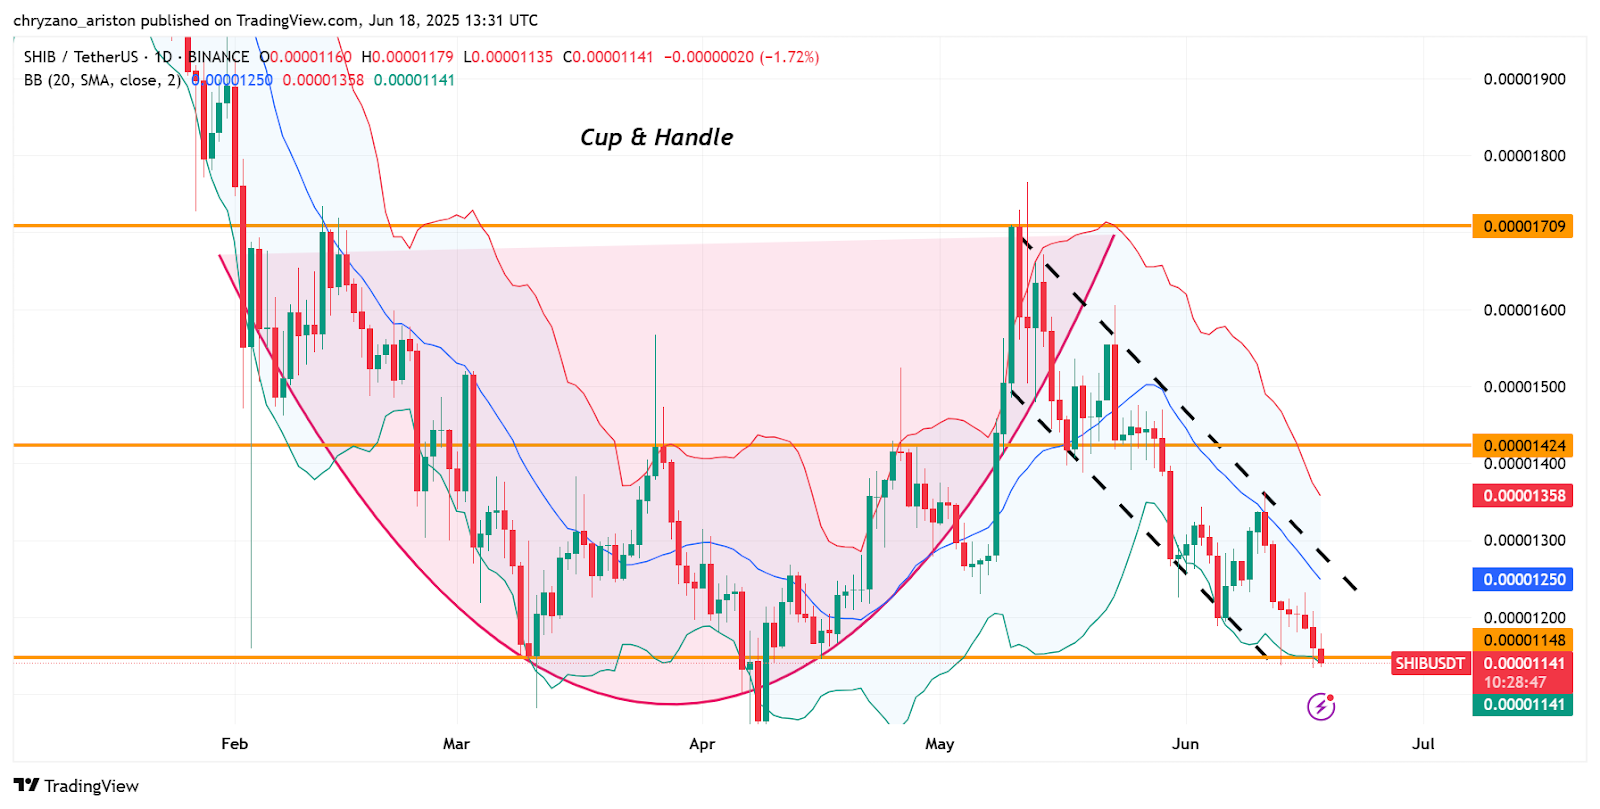
Source: Tradingview
According to the Bollinger bands, SHIB seems to be at its lowest point, as the indicator signals it is oversold. As such, there might be a retracement in the market, and SHIB could gain value in the future. However, the RSI reads a value of 33, but it has not crossed below the oversold mark. Since the RSI is does not indicate oversold condition the prices might fall further before a retracement.
After a small dip in price, there could be a bullish reversal. This bulls reversal usually follows after the formation of a conventional cup and handle pattern. In the event that the above thesis is validated, there is a high probability that the token could reach $0.000017 from $0.000011.
Please note that all price predictions are based on data analysis and are provided for informational purposes only. They do not constitute financial advice. Altcoin Desk is not liable for any financial decisions you make.