

As the whole crypto market awaits the approval of crypto ETFs with bated breath, the approval of a Solana (SOL) ETF met the expectations of many. In particular, REX Shares and Osprey Funds tweeted that the first-ever staked crypto ETF in the U.S will be available in the market on July 2, after the Securities and Exchange Commission (SEC) stated that it had “no comments” with the company’s Solana staked ETF filing. The new SOL ETF will track the price of Solana and generate yields through staking.
With the approval of the ETF, Solana shot up by 5%, helping SOL reach almost $160 in the process. However, the excitement in the market seems to have faded away as the prices started to crash again. At the time of publication, SOL is exchanging hands at $149 after gaining more than 2% during the past week.
SOL bulls break bearish shackles
In 4-hour charts, the bears have been constraining SOL’s price movement since May. Every single time the bulls tried to push the prices above, the selling pressure was overwhelming, and the bears got the better of the market. As such, with every effort that SOL tried to gain value, it only ended up making a new lower high. However, the situation became better just last week, when the bull broke the shackles and dismantled the bear’s methodical approach to tanking the prices. With bull’s effort complemented by the positive sentiment surrounding the approval of the SOL ETF, SOL printed a new high (red dot) after more than a month.
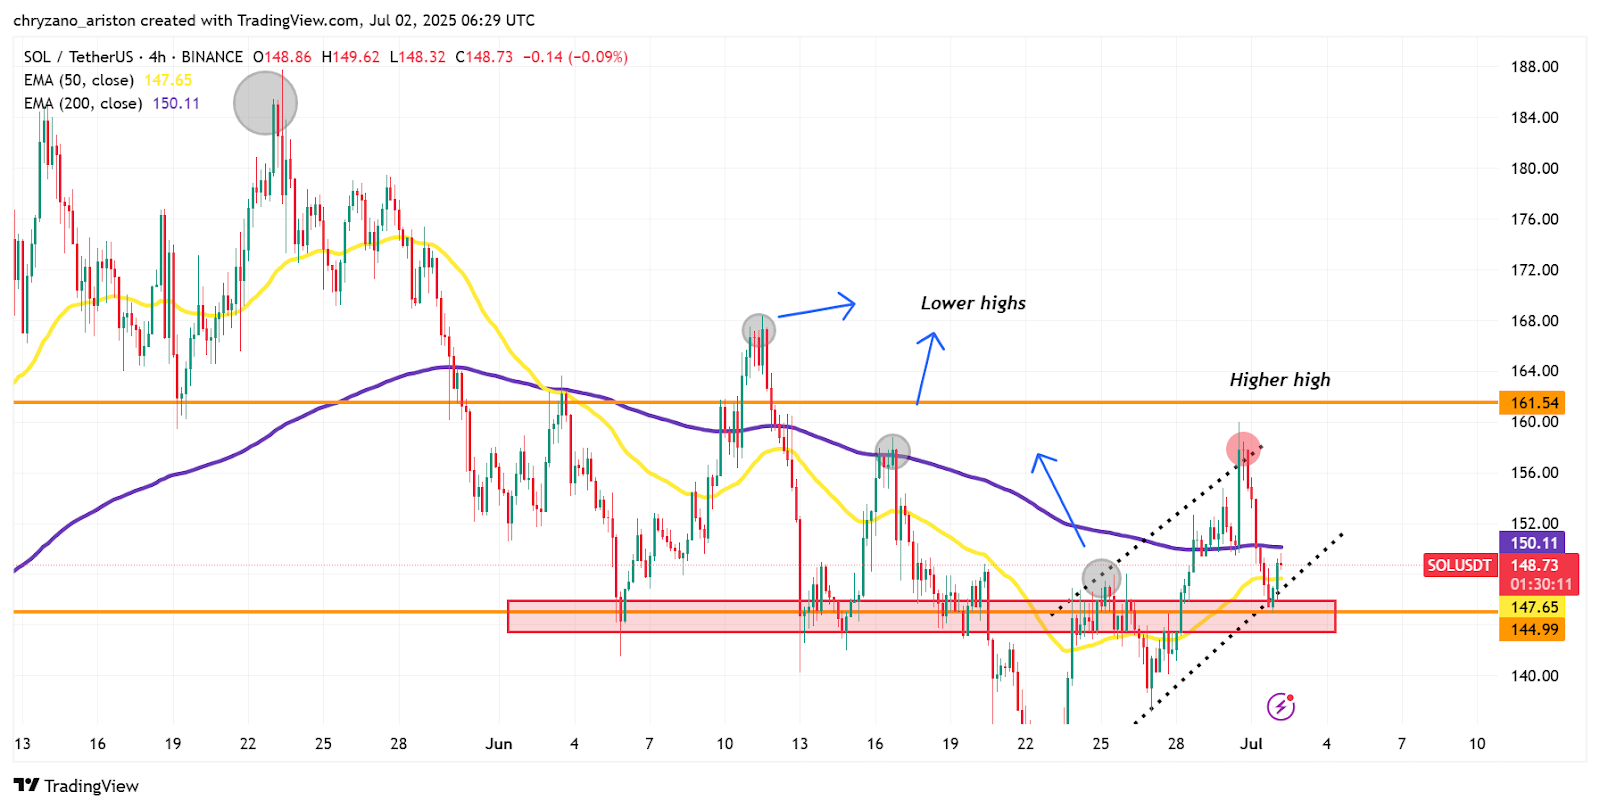
After establishing a higher high, SOL has reverted towards the lower trendline of the bear flag, which is close to the support level at $144. Usually, a token’s price will crash once the bear flag is validated; however, in this case, the situation is more complicated, as the technical indications signal something else. The 50-day EMA is approaching the 200-day EMA from below, and if these two intersect, there could be a Golden Cross (bullish), and SOL might even reach $160 if the intersection happens. However, SOL might need to get above the 200-day EMA at $150 if the Golden cross is to happen.
A bullish double bottom pattern spotted
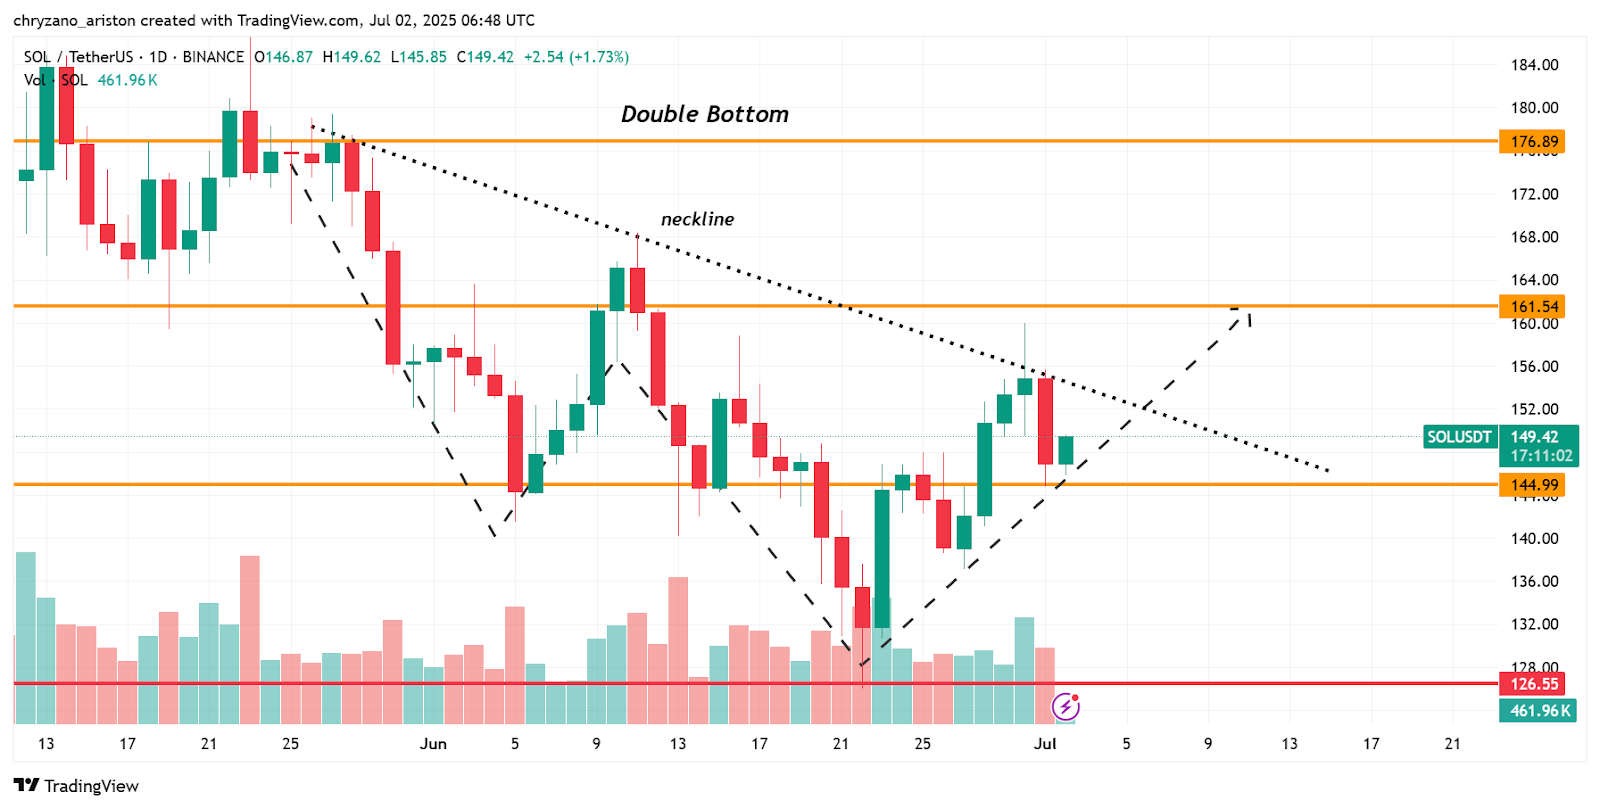
A double bottom pattern could be spotted on the 1-day chart. The double bottom is a bullish pattern where the price increases after fully forming the pattern. However, with SOL, it has completed the pattern and has spilled below the neckline rather than breaking out. So the question is, is SOL still on track to a bullish breakout, or has the double bottom’s bullish breakout already been invalidated?
Well, if SOL falls below the current support level at $144, then you could forget about a bullish break at least in the short term. However, if the token holds above the level mentioned, then it could test the neckline.