


Ethereum ETF spot inflows were quite steady throughout the past few weeks. In fact, Ethereum ETF recorded its highest net inflow for June on the 6th with $109M. In terms of the price, Ethereum is up by 2.43% during the past 7 days as the token shows a value of $2,540. Additionally, the ETH trading volume increased by 46% to $15B within the last 24 hours, showing that the traders are much interested in the token.
ETH may breakout anytime from the falling wedge
Let’s talk about some technicalities on the trading charts. As shown in the chart below, ETH is trading inside a falling wedge, which is a bullish pattern. At the time of publication, the coin has hit the upper trendline, and there is a high probability that it could rebound off the upper trendline. At the same instance where the coin touched the upper trendline, the Bollinger band indicates that the coin is overbought and therefore the market could correct the price. Hence, ETH could retrace and move towards the lower trendline.
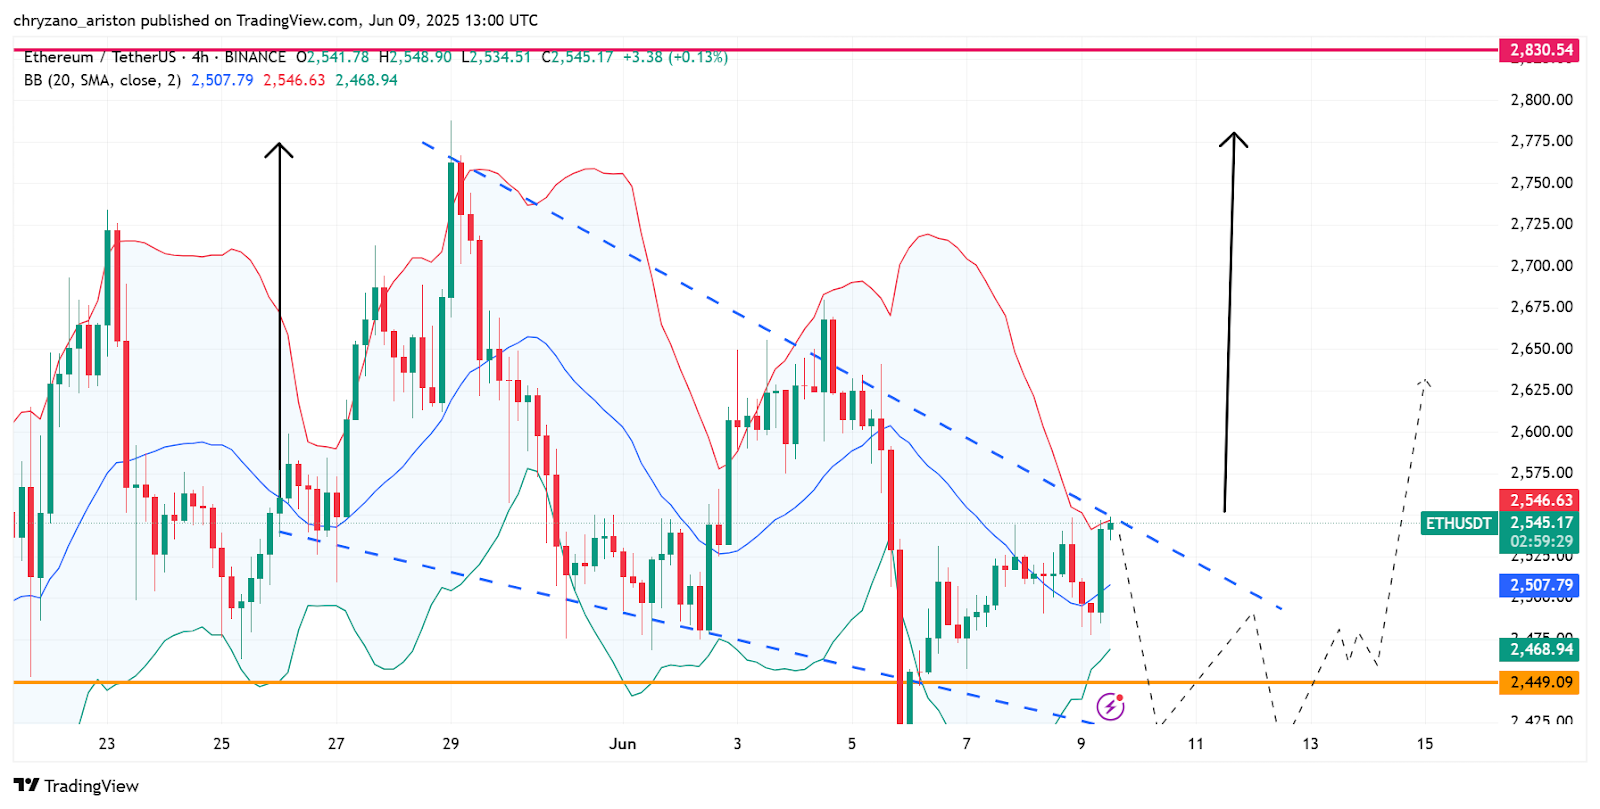
ETH/USDT 4-Hour Chart (Source: Tradingview)
The falling wedge pattern is not complete, however, there could be a breakout happening at any given time. For instance, if the breakout happens right now, ETH might reach as high as $2,800. This target is based on placing the height of the wedge at its widest near the breakout point.
ETH swings wildly
On the weekly, ETH is taking the pattern of a megaphone also known as the broadening wedge. When a crypto is trading inside a megaphone, there is high volatility as the coin makes higher highs and lower lows. This shows that there is indecisiveness as the price swings wildly and traders are reacting to news, emotions and other factors.
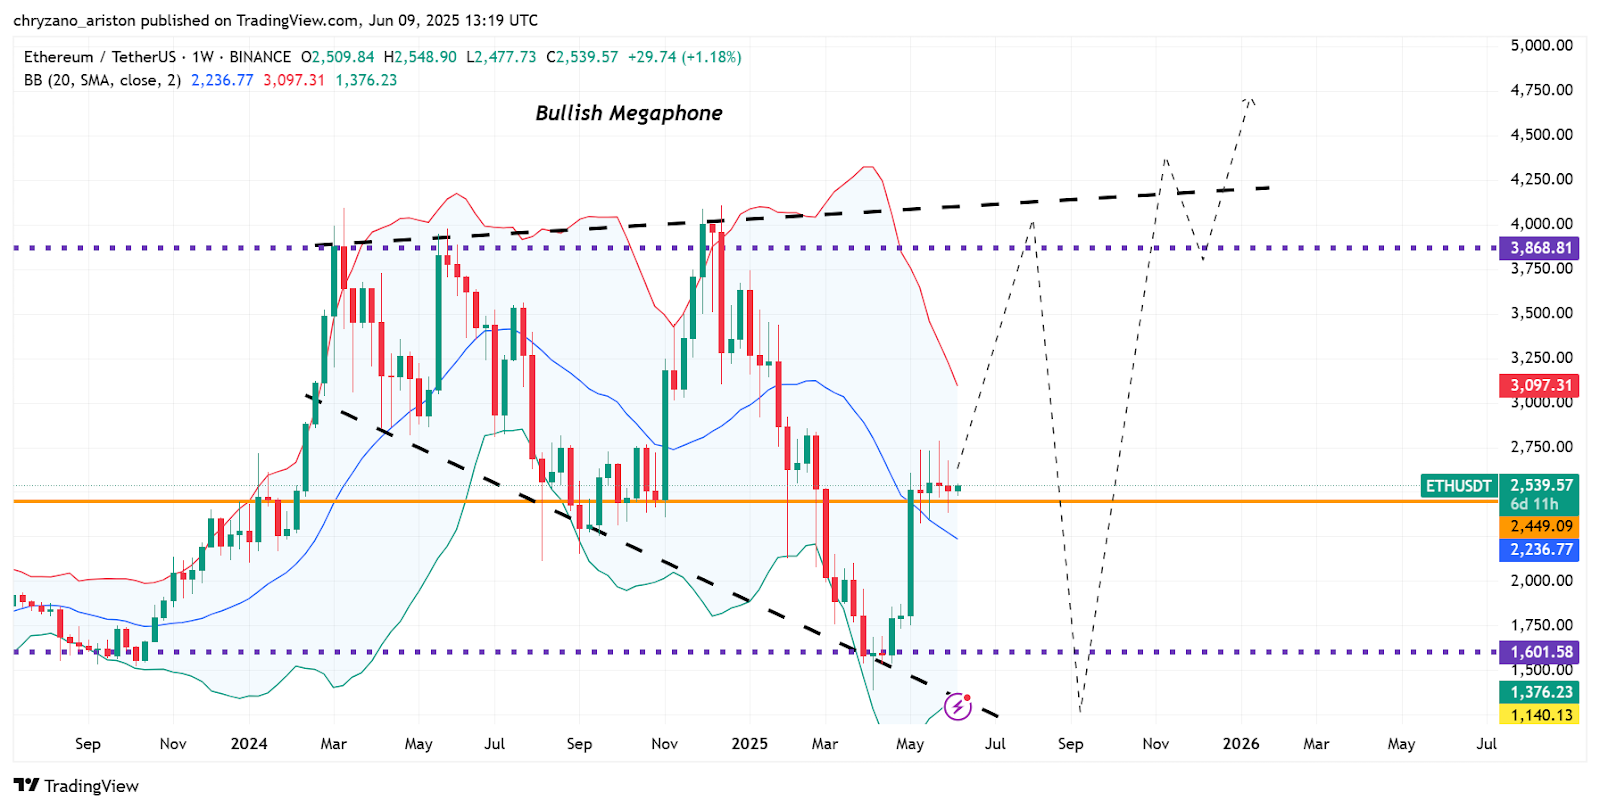
ETH/USDT 1 week Chart (Source: Tradingview)
Since ETH is at the middle of the megaphone as it rises towards the top, there is a high chance that the coin could hit $3,800, given that this trend continues. Neither the RSI nor the Bollinger bands signal a counter effect on ETH’s motion. Additionally the MACD line which reads a value of -98 has titled towards the positive region and the line might cross the zero line and move onto the positive side of the scale. This further indicates that ETH might be on a roll in the coming days.
Disclaimer: All price predictions are based on data analysis and are provided for informational purposes only. They do not constitute financial advice. Altcoin Desk is not liable for any financial decisions you make.