As the crypto market awaits the arrival of the altcoin season with bated breath, a Cryptocurrency trader who goes by the pseudonym Merlijn The Trader spotted a bull flag forming on the Altcoin Season Index (ASI) chart, and expects the altcoin season to arrive fast.
In the X post, the trader wrote: If this fires, expect a full rotation out of Bitcoin and into altcoins. Moves could be explosive.”
Altcoin Season is loading…
— Merlijn The Trader (@MerlijnTrader) August 13, 2025
The index just printed a bull flag and it’s primed for breakout.
If this fires, expect a full rotation out of Bitcoin and into altcoins.
Moves could be explosive. pic.twitter.com/n9AuQxmlex
The ASI, which is self-explanatory, depicts the current market status. When the ASI value goes above 75 on the indicator, it denotes that it’s altcoin season, and if the value drops below 25, it is Bitcoin season. Any value that lies between 25 and 75 is considered neutral. Since the current value is 51 on the ASI chart, the market is neutral; however, since the ASI is inside a bull flag, it may break out at any moment.
The ASI chart is one of the indicators that could be used to determine whether it’s altcoin or Bitcoin season. Another main aspect to consider is the Bitcoin dominance. Bitcoin dominance is a metric that shows Bitcoin’s market capitalization as a percentage of the total cryptocurrency market capitalization. When it takes a higher value, it means that the traders fancy BTC over the altcoin, and when it falls, traders favor altcoins.
Bitcoin dominance falls from 65% to 59% in the last two months
$BTC dominance fell from 65% to 59% over two months, underscoring the growing appeal of altcoins amid broader risk-on behavior. pic.twitter.com/5OM7uP211M
— glassnode (@glassnode) August 13, 2025
According to Glassnode, an analytical platform, the Bitcoin dominance has fallen from 65% to 59% over two months, which shows the growing appeal of altcoins. During altcoin season, it’s common for Bitcoin dominance to fall even while Bitcoin’s price rises. This happens because traders rotate capital from Bitcoin into altcoins, which often surge faster than Bitcoin itself. Even though Bitcoin’s price may be increasing, the combined market value of altcoins grows at a faster rate, reducing Bitcoin’s share of the total crypto market. Typically, Ethereum leads the rotation, followed by smaller-cap altcoins, and the period is often accompanied by increased social media buzz and higher trading volumes across the altcoin market.
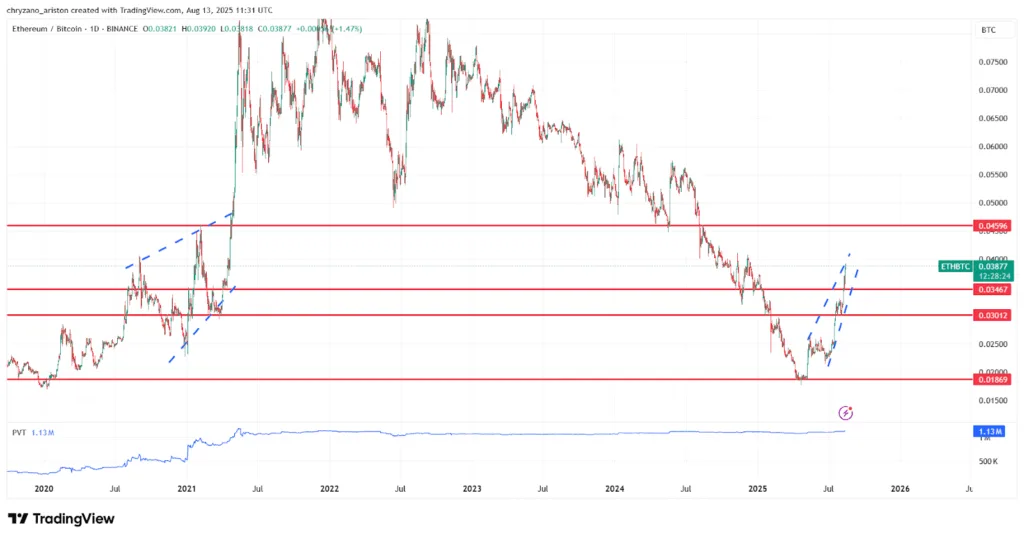
When the altcoin season is about to begin, funds will be flowing from Bitcoin to Ethereum. Taking a look at the ETH/BTC pair, we could note that ETH is gaining value against Bitcoin. The ETH value was 0.018 BTC back in April; however, its price has gained value and moved to 0.038, and it could be moving further higher.
2021 altcoin season rising wedge appears on charts, is this the beginning of an altcoin season

When checking the charts, we stumbled upon a rising wedge that looks very similar to the rising wedge that formed during the previous bull run (2021). If this is a repetition of the past, then there could be a breakout, and ETH will reach as high as 0.08 BTC.


