The much-anticipated altcoin season, which follows after the Bitcoin halving year, is finally here. Two main metrics and one supporting parameter, which gives away that we have entered the altcoin season.
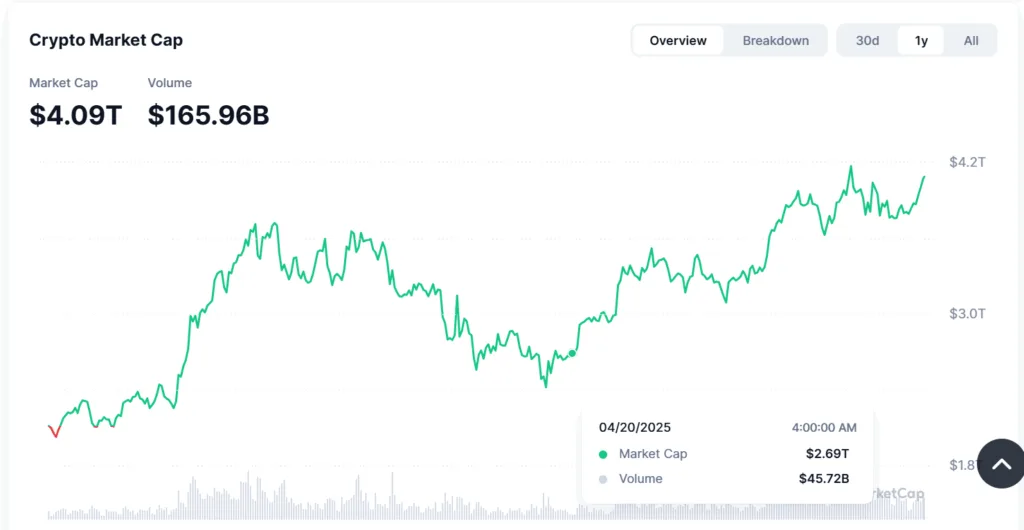
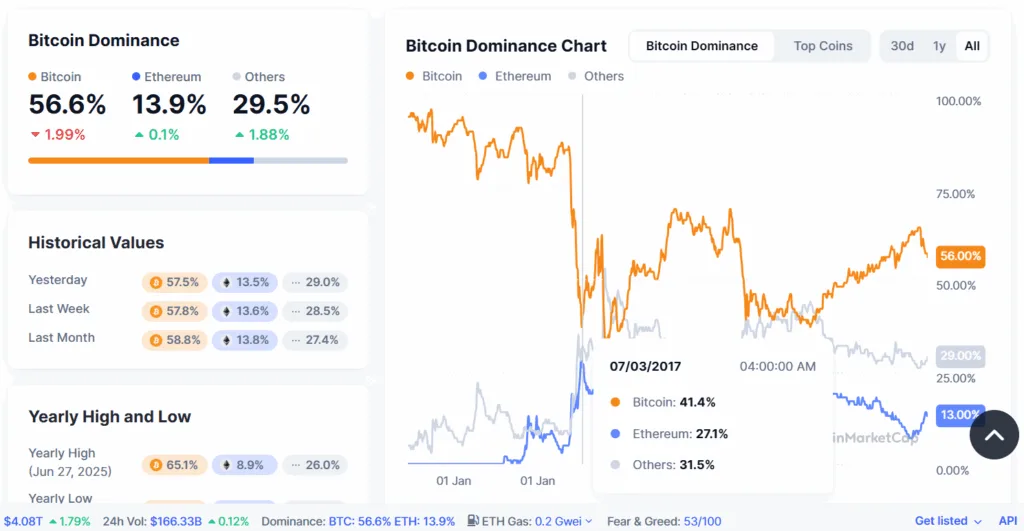
The first indication, a no-brainer, the Altseason indicator flashes green, and the Bitcoin Dominance has fallen. In addition, the total crypto market capitalization has crossed above $4 trillion, signalling that money is flowing into the market.
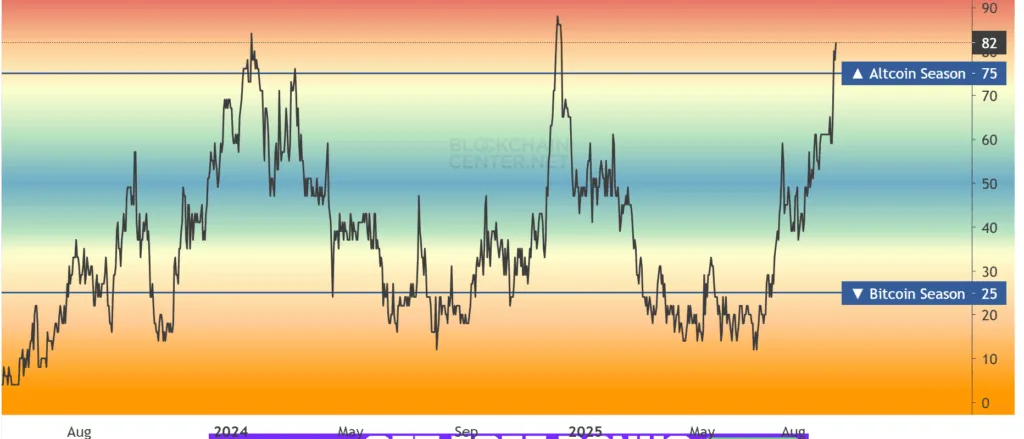
After waiting 8 long months in 2025, the Altcoin Season Index (ASI) has moved into the altseason territory. This major shift in investors preferring altcoins over Bitcoin comes in an interesting period when the total crypto market crossed above the $4 trillion level.

So what does the ASI indicator mean?
The ASI is an indicator that has a scale that runs from 0 to 100. It basically gauges the performance of the altcoins against Bitcoin. Values between 0-25 are considered as Bitcoin season, values ranging from 25 to 50 signify a neutral market, while values between 75-100 are considered to be the altcoin season.
At the time of publication, the ASI reads 82 on its scale, denoting that 75% of the top 50 coins have outperformed Bitcoin for the past 90 days.
Total crypto market surges
The total crypto market cap, which is the aggregate value of the token supply multiplied by the respective token, has reached above the $4 trillion level. An increasing market cap shows that the crypto market on the whole is increasing and gaining traction from investors. This also means that there’s more capital flowing into the market.

Bitcoin dominance falls

Bitcoin’s dominance is the BTC market cap with respect to the aggregate value of the total market capitalization. This value dropped from 57% last week to 56%, a quite minute change.
What do all these mean?
The ASI index is just straightforward and is the final result, which shows the altseason. But the remaining two, the total market capitalization and the Bitcoin dominance, have a deeper message. When the total market cap increases, it shows that money is flowing into the crypto market; however, it could be moving into Bitcoin or the altcoins. The Bitcoin dominance comes in handy to determine whether money is flowing into BTC or altcoins. The higher the Bitcoin dominance value, the more money is flowing into BTC, while a drop in Bitcoin dominance suggests the altcoin season is in.


