


Solana Whales repositioned themselves after causing havoc in the SOL derivatives market, which led to a $48-$50M long squeeze on the Hyperliquid exchange. During a long squeeze, traders who have taken long positions (betting the price to appreciate) sell their positions to stop their losses. However, later on, when the positions were liquidated, the Whales repositioned themselves with $8.5 million long positions. Analysts predict that with this Whale activity, the price of SOL could reach as high as $300, but is it feasible? Let’s take a look at the technicalities.
Will SOL pop back its dislodged right shoulder?
On the daily chart, Solana is about to complete the head and shoulders pattern, as it faces resistance at $150. Since the token has rebounded off the neckline and is equal in height to the left shoulder, the next phase of the pattern would be the drop below the neckline at $143. If the full pattern is to be completed, SOL might fall as low as $124. However, in the event the bulls charge and chase out the bears in the market, SOL might be able to escape the bearish head and shoulder pattern.
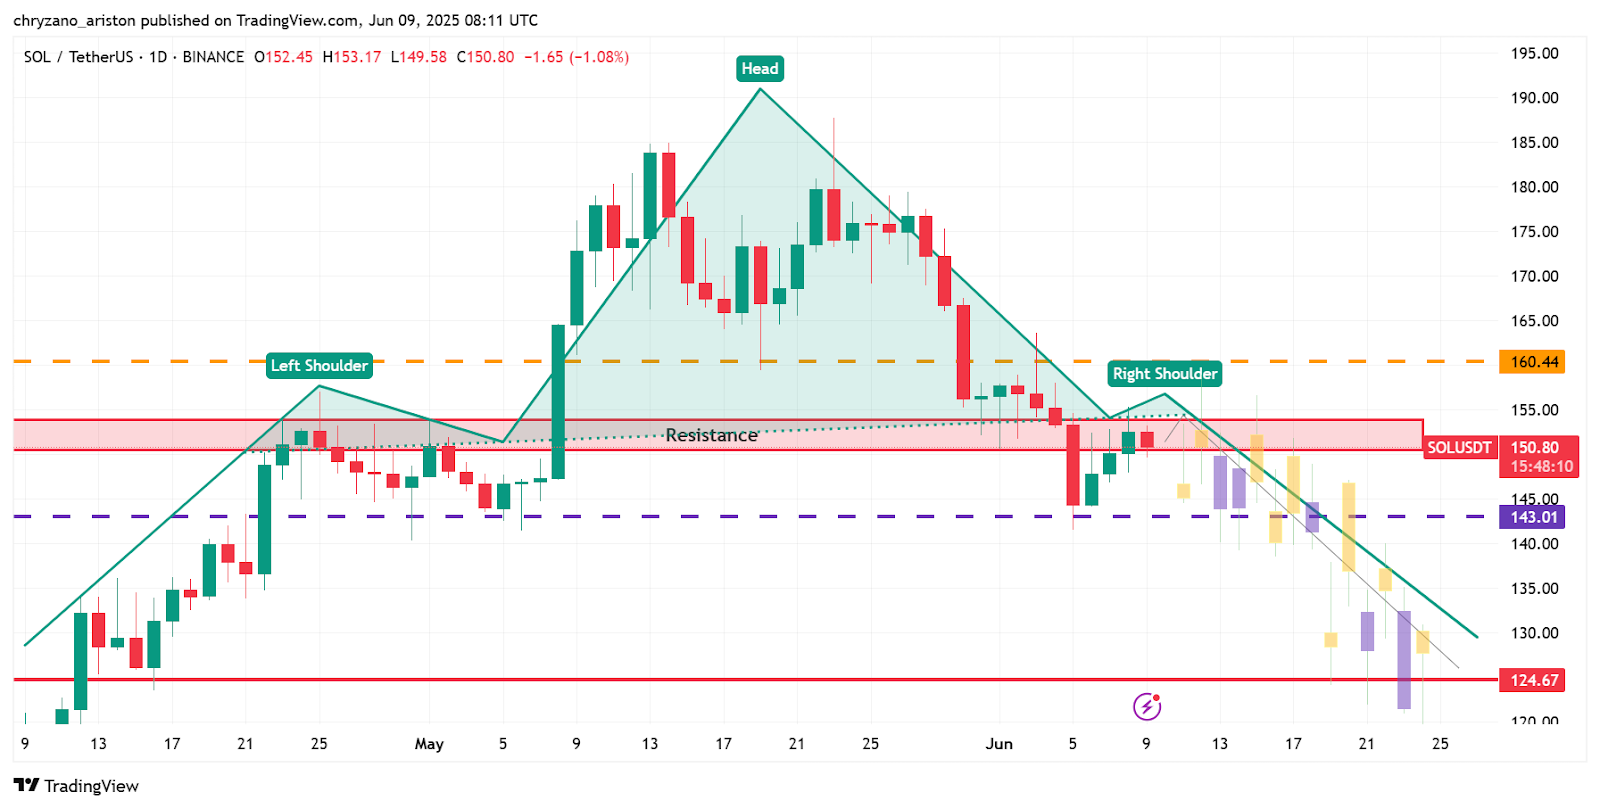
SOL/USDT 1-Day Chart (Source: Tradingview)
When looking at the technical indicator–Bollinger band, SOL was oversold when it rebounded off the neckline at $143. However, at the time of publication, the token is just below the SMA (Simple Moving Average), which denotes that SOL is performing below par.
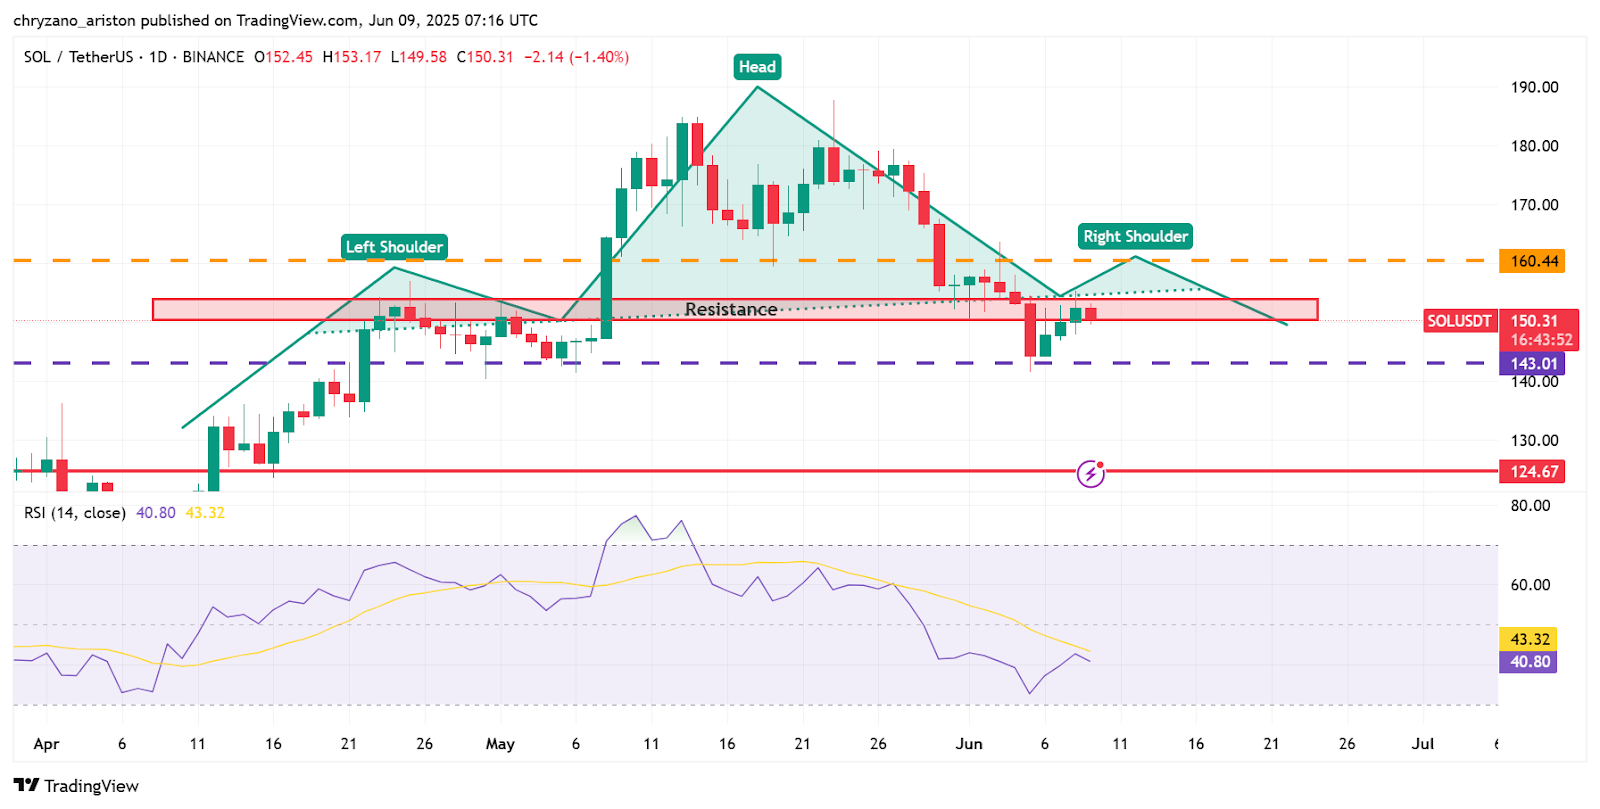
SOL/USDT 1-Day Chart (Source: Tradingview)
The Relative Strength Index indicator has also gone below the SMA, and the line is facing towards the oversold regions as it signals a value of 40. Overall, the market is looking dull on the daily chart for SOL, as the head and shoulders pattern is a bearish pattern. So the charge towards $300 looks very steep. Forget the daily and let’s look for some good news in the weekly chart.
SOL’s weekly chart is in a spot of bother
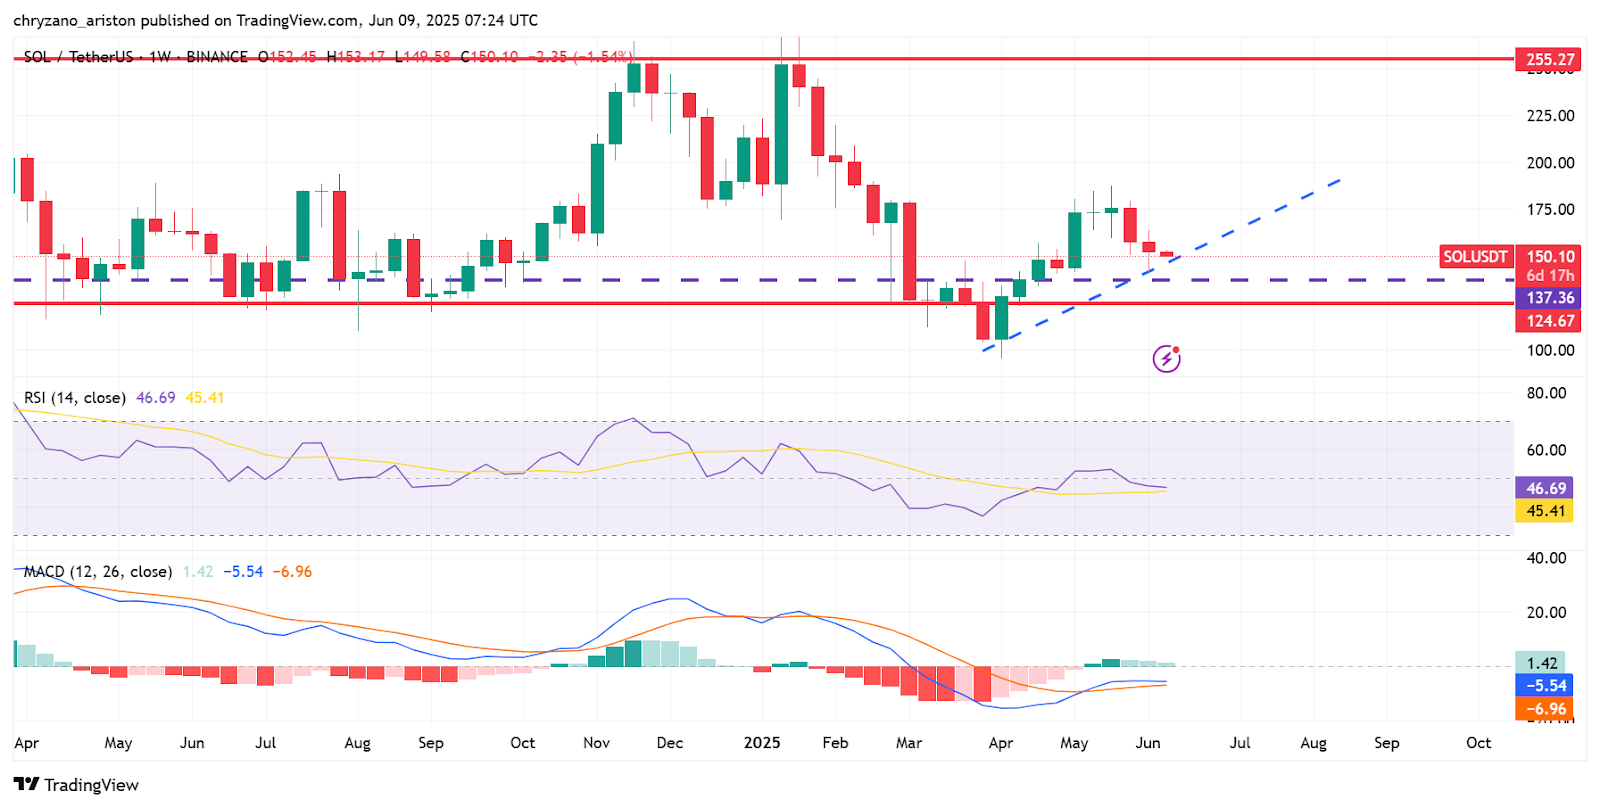
SOL/USDT 1-Week Chart (Source: Tradingview)
My bad, did I say good news? I take it back as SOL is not in a good position. Currently, SOL is being supported at a crucial support level on the weekly chart at $150. If SOL falls from this support level, the uptrend of making higher lows, as shown by the blue broken lines, might be dismantled. So will SOL break below this support level? Let’s see what the indicators have to say.
The RSI line reads a value of 46, which is quite neutral; however, what you need to consider is that the RSI is very close to the SMA, and there might be an intersection very shortly. If the RSI crosses below the SMA from above, then SOL might break below the crucial support level at $150. Similarly, the MACD is also dangerously close to the SMA, and if they intersect, SOL might not be able to hold on to the support level. As such, it would be wise for traders to wait for the market to go in either direction before taking any positions.
Disclaimer: All price predictions are based on data analysis and are provided for informational purposes only. They do not constitute financial advice. Altcoin Desk is not liable for any financial decisions you make.