
Stablecoin transactions on Solana hit $650 million for the month of February, a threefold increase month over month. When put into context with the future commodities on CME, stablecoin transaction volume is about 9 times greater, stated a crypto netizen. However, an analyst stated that although stablecoin volumes may be large, it is important to focus on what they represent.
The stablecoin transactions on the Solana network spiked up, hitting $650 million for the month of February. With the transaction volume for February touching $650 million, the overall aggregate stablecoin transaction volume is now hovering around the $2 trillion per month level.
The surge in volume follows after the launch of Western Union’s $USDPT, Jupiter’s $JUPUSD, which has gained traction amid its goal of returning a yield back to the ecosystem. With the launch of these two stablecoins, the volume on the Solana network tripled month over month, and it is expected to further increase in the coming days.
To put into context, the CME Group futures trading in gold just hit a record $208 billion per month. However, the stablecoin market is 9X greater than the futures commodities.
“Stablecoin volumes are clearly large, but the more important point is what they represent. This is payment activity, not trading, so comparing it to something like gold futures is misleading. What matters is that stablecoins are now being used to move money at scale, both within crypto and increasingly across real-world financial flows. They’re no longer a side tool; they’re becoming part of the core financial infrastructure.” Lavneet Bansal

However, compared to the stablecoin market cap on Ethereum, the stablecoins on Solana are quite insignificant. Putting stablecoin activity by network into context. Ethereum dominates the market, capturing more than 50% of the total stablecoin market, while TRON is the second-largest network and Solana the third.

Although Tether dominates with market cap, USDS. USDS is a stablecoin within the MakerDAO/Sky ecosystem and is not as widely recognized as USDC or USDT.

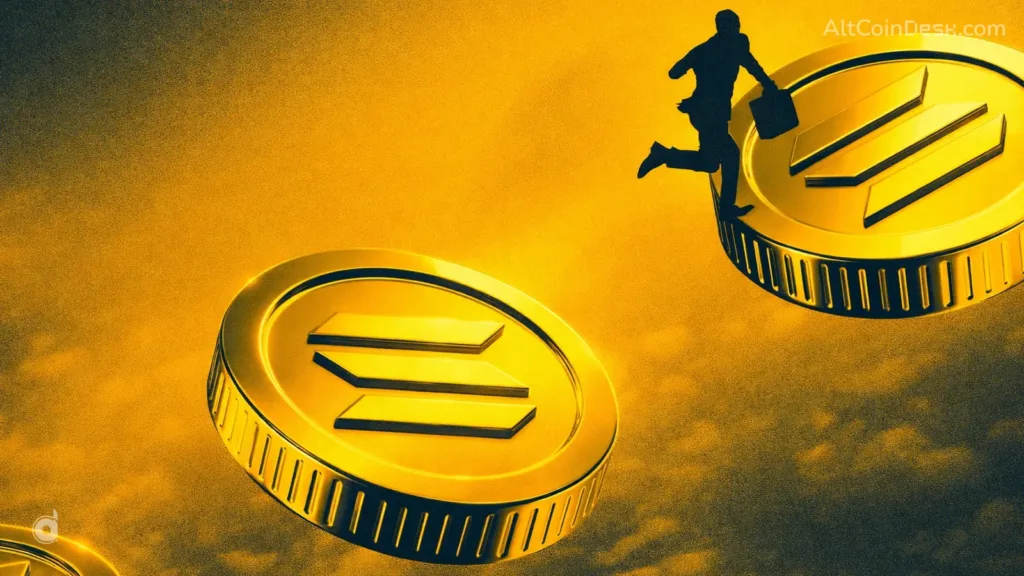
Looking at the Solana daily chart, it is trading inside the bear flag. Solana’s crash continued as it fell into a bear flag, where price briefly consolidates after a sharp downward move. This consolidation usually forms a small upward-sloping channel or a tight range, but instead of signaling strength, it represents a pause where sellers are taking a break and buyers are attempting a short-lived bounce.
During this phase, volume often declines and the upward moves lack conviction, as the broader trend remains bearish. Once the lower boundary of the flag breaks, selling pressure typically resumes, often with a continuation of the initial downtrend. The breakdown can trigger stop losses and invite fresh short positions, leading to another impulsive move lower that mirrors the size or momentum of the prior drop.