
Technical analyst who goes by the pseudonym Crypto Crew University saw, XLM testing the support level at $0.37. With Relative Strength index (RSI) above 50 and the Stochastic RSI crossing below the signal line the analyst is tentative whether it is a momentum shift or just a dip.
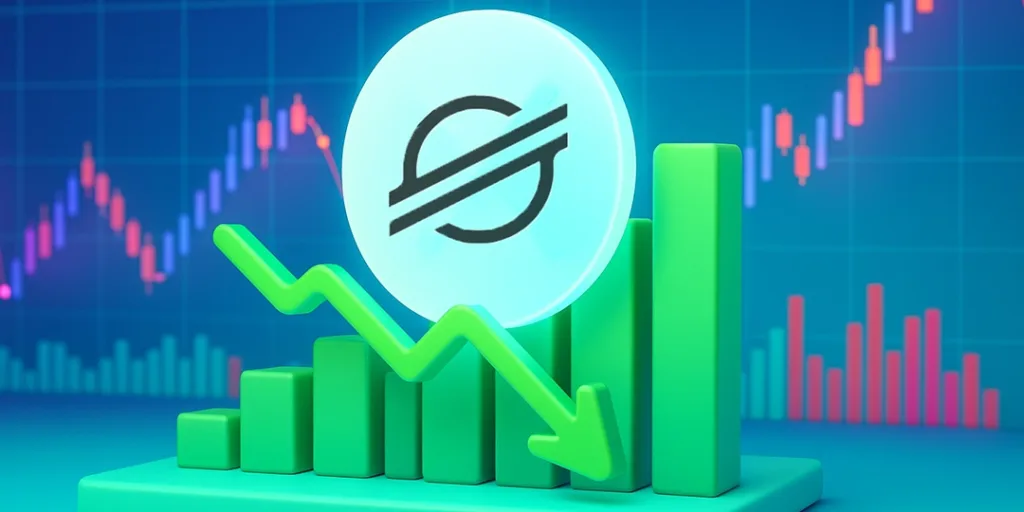
XLM gains 70% in value during the last month
Meanwhile, Stellar’s token XLM captured the first place on CoinMarketCap after the token gained more than 70% value in the last month. During the first week of July, XLM was trading at $0.24; however, with the mounting bull pressure, the token started to gain value exponentially. By mid-July, XLM reached $0.5, and following this hike, XLM was consolidating between $0.40 and $0.5. At press time, it is exchanging hands at $0.411.

On the 4-hour chart, XLM is trading inside a falling wedge making lower lows and lower highs. The falling wedge is usually a bullish reversal pattern. Inside the falling wedge, sellers lose momentum, while the buyers slowing but surely take over the market.
XLM bulls wait patiently for the breakout
Initially, bears push the highs and make lower highs and the same happens with the lows, as the prices keep going down deeper. However, as the prices fall, the gap between the trendlines narrows, the sellers fade away and eventually, the buyers take over. Once the buyers take over, XLM will breakout and reach new highs.

On the above chart XLM has been rejected off of the upper trendline and a breakout to the upwards direction, is not something that could happen at least for now. As such, the price may fall towards the lower trendline continuing its zig zag motion until the buyers stamp their authority. Once the buyers step in numbers, the token will reach $0.5.