
The bull run, the altcoin season, and the all-time highs that the crypto community was expecting were like a mirage in the desert. Many analysts promised: it’s just a couple of days; once we go through the bumpy part, it’s plain sailing. After the next interest rate cut, prices will increase. It’s just consolidating, wait for it.
But once we got there, hoping for a miracle, there was no magician there to pull rabbits out of a hat. However, here’s some solid data that is from a reputable source to satiate the longing and thirsty soul.
The Consumer Price Index (CPI) for September was released yesterday, and it showed that inflation was cooling. John Kerschner, global head of securitized products at Janus Henderson, stated:
“Like an oasis slaking the thirst of a weary desert traveler, today’s CPI number offered investors the first tidbit of information from the barren wasteland of government data that has existed since the shutdown started Oct 1,”
CPI comes softer than expected
The CPI is a metric that calculates the average change in price of a basket of goods and services that are used by consumers. Dow Jones forecasted the CPI to be 0.4%, however, it turned out to be lower at 0.3%. Put it into simple terms, an item costing $100 should be at $104 now, according to Dow Jones, but it is $103.
Market cap forms new uptrend
The crypto market is licking its wounds as the market cap has risen above $3.75 trillion from $3.6 trillion a couple of days ago. It has a volume of $123 billion, which is not bad for a market that is just recovering after a bad crash.

Traders become fearless
The market sentiment is also changing from fear-ridden to a more relaxed mood. The Fear and Greed index is 34, which is in the fear zone. Although the indicator says that the traders are still in fear mode, it’s not the case. If you consider last week’s reading of 25– deep fear zone, now the market is more neutral at 34. This means that the traders will consider entering the market.

Bitcoin is currently trading at $ 111,500 after gaining approximately 5% during the past week. More importantly, the flagship cryptocurrency has established an uptrend on the weekly chart, with decent volume.
BTC fluctuates inside a bullish pattern
The chart below shows the bigger picture of how BTC behaved during the past month. As shown below, the flagship crypto has been making lower lows and lower highs inside a falling wedge. Although the name of the pattern is ‘falling’, however, it is a bullish pattern, where the prices break out upwards once the pattern is complete. So as long as Bitcoin traders are within the falling wedge, it should not be a problem. As long as BTC fluctuates within $112.6K (upper limit) and $106K (lower limit), it will appreciate.

On the Ethereum chart, the token has discontinued its pattern of forming lower lows, as shown in the chart below. As institutions and whales go into a buying frenzy, the ETH was able to recover even before it hit the lower trendline, as shown in the chart.
The budding green candlesticks could be the beginning of a bull run that could take the prices to as high as $6,000, according to some crypto netizens. However, before ETH reaches this dream price level, it will first need to overcome the 50-day EMA at $4,125.

So now that we spoke about the ETH, let’s not forget about the other tokens– the altcoins. The altcoins season, which was anticipated for a long time, has not arrived yet. The Altcoin Season Index on CoinMarketCap is still in the Bitcoin season.

However, an analyst who goes by the pseudonym figured out that Ethereum has crashed and held above the upper trendline of a bullish symmetrical triangle pattern. While the prices were holding above the trendline, the RSI is in the neutral zone– similar to the 2021 bull run. In fact, when the market is in fear mode as it is now, it means that we are at the floor or bottom price before the next leg up.
Whales go into buying frenzy
But how do we know that we are at the bottom of the phase before the next spike? Easy, just check what the whales are doing. Some whales are transferring stablecoin from cold wallets and treasuries to the exchange, probably to go into full-on buying mode, while others are accumulating and transferring their acquired tokens to cold wallets.
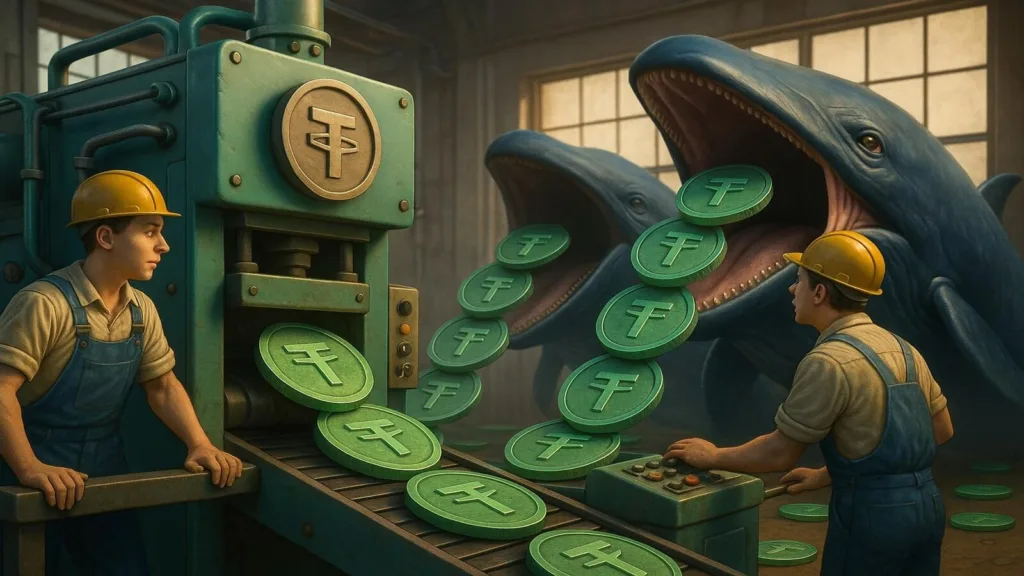
Stable issuer increases supply

Tether minted 1 billion USDT mid-September and another 1 billion early October, with some other smaller stablecoins also being introduced in larger quantities. Stablecoin issuers usually mint tokens and increase the supply to help liquidity and meet the increasing demand, which usually happens before a bull run.
So the bottom line of what’s happening is that the CPI is softer than expected, which means the next week’s Federal Open Market Committee meeting might have an interest rate cut coming.
In the crypto market, Bitcoin and Ethereum are just starting their uptrend, or they are just a bit above ground level. With stablecoin issuers minting more tokens and whales going into to buying frenzy, you know what time it is. Maybe the other times you walked into mirages after seeing an oasis from afar. But this week’s solid evidence is too hard to deny. If by any chance you happen to see a mirage, trust me, it won’t be a mirage, but a pot hole, at least.