
Feeling lost looking at crypto charts? Don’t worry! This guide breaks it down into easy pieces. Soon, the TradingView charts won’t look so scary.
Think of a crypto chart as a picture story. It shows what buyers and sellers have been doing with the price. Learn a few simple things to help you make smarter trading choices.
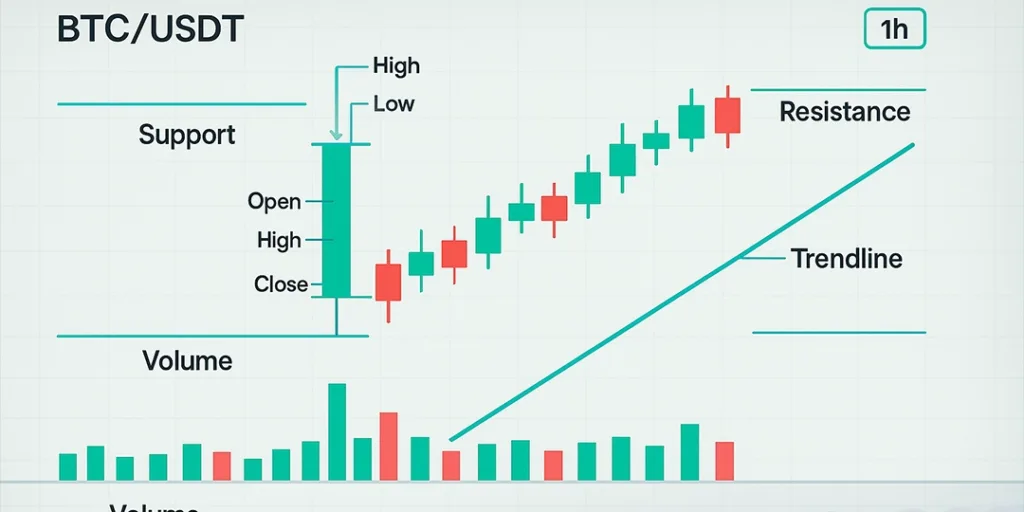
The main picture: Candlesticks
Most crypto charts use candlesticks. Each candle represents a specific time (such as 1 minute, 1 hour, or 1 day).
- Open: The price when the time started.
- High: The highest price reached.
- Low: The lowest price reached.
- Close: The price when the time it ended.
- Green/White Candle: The price closed higher than it opened. Buyers were in control.
- Red/Black Candle: The price closed lower than it opened. Sellers were in control.
- Long Wicks (thin lines): Show big price swings up or down during that time.
Important crypto chart parts
- Pairs: You always trade one crypto against another, like BTC/USDT. BTC is what you trade, and USDT is like your money.
- Timeframes: How long each candle represents (1 min, 1 hour, 1 day, etc.). Short times show lots of little moves; long times show the bigger picture.
- Volume Bars: Colored bars at the bottom show how many coins were traded. Big volume means a price move had strong backing.

What candles tell us
- Green Candle (Bullish): Buyers pushed the price up. Good sign.
- Red Candle (Bearish): Sellers pushed the price down. Caution sign.
- Doji (tiny body): The Open and close were almost the same. Means the market is unsure. The next candle often shows who wins.
Key tools on the crypto charts
- Moving Average (MA): Shows the average price over time (like the last 20 days). A smooth line.
- Line going up? The price trend might be up.
- Line going down? The price trend might be down.
- If a short MA line crosses above a long MA line, it might mean the price is starting to rise.
- Relative Strength Index (RSI): Measures speed (0 to 100).
- Above 70: Might be too high (“overbought”); the price could drop soon.
- Below 30: Might be too low (“oversold”); price could rise soon.
- Support & Resistance:
- Support: A price level where buying often happens, like a floor. Price often bounces up from here.
- Resistance: A price level where selling often happens, like a ceiling. The price often falls down from here.
- Trendline: A straight line connecting higher lows (uptrend) or lower highs (downtrend). It acts like a slanted support or resistance line. Breaking through it can signal a change.

Spotting patterns on the crypto charts
Charts sometimes form shapes that hint at what might happen next:
- Head and Shoulders (Top): Three peaks—the middle one is the highest. Often means an uptrend is ending; the price might fall. (An upside-down version means a downtrend might end, and the price might rise.)
- Double Top: Price hits a high twice but can’t break higher. Often means the price might fall.
- Double Bottom: Price hits a low twice but can’t break lower. Often means the price might rise.
- Triangle: Price moves get smaller, forming a triangle shape. Breaking out of the triangle often means a strong move in that direction.
A few more helpful tools
- MACD: Shows the relationship between two moving averages. When one line crosses above the other, it might mean rising momentum. Crossing below might mean falling momentum.
- Stochastic Oscillator: Similar to RSI. Above 80 = possibly overbought. Below 20 = possibly oversold.

More you need to know about the crypto charts
- Long: You buy first, hoping to sell later for more money.
- Short: You bet the price will fall. You sell first (usually borrowed coins) and aim to buy back cheaper later.
- Entry: The price at which you start a trade.
- Exit: The price at which you end a trade (to take profit or cut loss).
- Technical Analysis (TA): Using charts and patterns to guess future price moves.
- Fundamental Analysis (FA): Looking at news, tech, and how much people use crypto to judge its real value.
- Bull Run: Prices have been going up strongly for a long time.
- Bear Market: Prices have been falling for a long time.
- Volatility: How much and how fast the price jumps around. Crypto is VERY volatile!
The bottom line
Crypto charts are just tools telling the story of price action. Start by learning candlesticks, volume, support/resistance, and simple indicators like the RSI. Practice on real Bitcoin or Ethereum charts and try spotting these signals yourself. Soon, you’ll feel more confident in understanding the market’s story. No confusing words needed!