
Render has broken out from a bullish falling wedge and is rising vertically on the daily, ending its 6-month-long downtrend. However, the token has 2023 levels, which catapulted the token to its all-time high of $13.
RENDER is trading at $2.1 after exponentially gaining value from below its weekly opening market price of $1.3. Within the past 7 days the token added 63% to its price, while its trading volume increased by almost 10%, rising to $163 million.
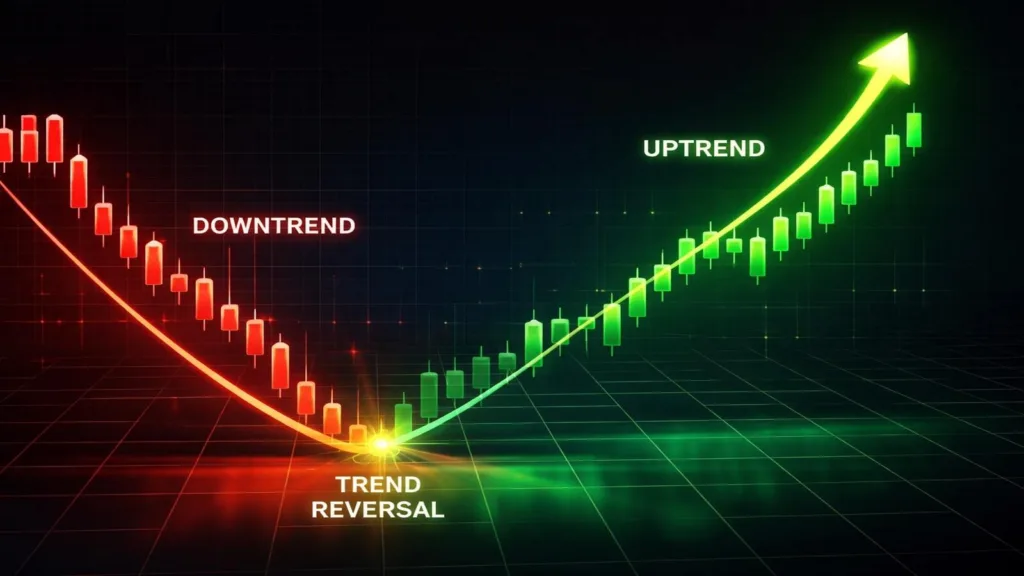
When looking back at RENDER’s price action within the last 6 months, the token has been on a downward trend, making lower lows and lower highs. In trading pattern terms, the token fluctuated inside a falling wedge, which broke out into a rally.

Inside a falling wedge, the selling pressure weakens while the buyers quietly accumulate. The volume eventually contracts, and traders wait for a breakout that often triggers a sharp bullish move. A typical breakout from a wedge produces a bull rally, which is often the size of the wedge at its widest part.
Given that RENDER follows this typical breakout, it should reach at least $2.5; however, it has just reached $2.1, and the Relative Strength Index indicator shows that the market is overbought. This means that RENDER prices will be stopped in their tracks, at least momentarily.
Although RENDER might be stopped in its tracks on the daily chart, the weekly chart has an altogether different overview. On the weekly chart, Render is resting on a launchpad, which catapulted the prices above $10 back in 2023.

Given that history repeats itself, another spike to these levels is not impossible. The technical front, which shows a falling wedge on the weekly chart, supports the thesis of a breakout. As mentioned earlier, if the falling wedge on the weekly chart explodes, the token could reach $10. It was this rally that started in 2023, which took RENDER to a new all-time high. With the bullish sentiment building around crypto, another all-time high for RENDER might be on the cards.