
When emotions run wild, people become unruly. So what if your emotions could be quantified or measured? Let’s say you get angry, or happy, sad, or depressed, and if someone asked you how happy, sad, or depressed you are, what would you say? Probably something like “very happy,” “very sad,” or “ecstatic,” or if you are angry, it would be “super mad,” “livid,” and so on. But what if there was a tool to measure your emotional level with your behavior in that excited state? Like gauge your emotion based on how you act.
For instance, let’s say you were talking badly about your colleague, and then someone uses this emotion-measuring tool on you, and the reading shows “angry.” And then all of a sudden, the meter reads “very angry” when you start cussing. The Fear and Greed Index indicator works on the same principle, where it gauges the overall behavior of the traders and derives the emotional state or the sentiment of the market.
Technically, it is called behavioral finance. Behavioral finance brings together two components: the psychology of the person trading and the economics to explain how psychological influences and cognitive biases impact the financial decisions of investors and market practitioners.
What is Fear and Greed Index?
The crypto Fear and Greed Index was invented by CNNMoney (now CNN Business) in the early 2010s. The main purpose of this tool was not to predict markets but to aggregate multiple behavioral market indicators and, thereafter compile and translate them into a readable sentiment gauge, and thereby help investors understand whether markets were being driven more by emotion than fundamentals.
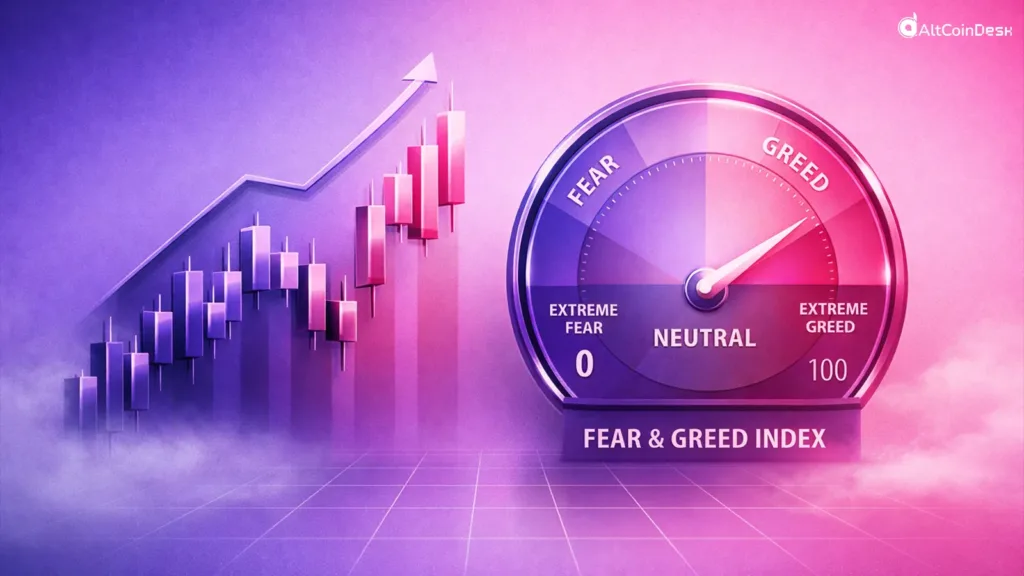
The indicator has a segregated measurement scale that runs from 0 to 100. Values from 0 to 20 on the Fear and Greed Index scale mean the market is in extreme fear; 20-40 values signal that the market is in fear, while 40-60 means that the market is neutral. 60-80 values show greed, while values above 80 signify extreme greed.

How is fear and greed index calculated?
To give an overall view of the market sentiment, the crypto Fear and Greed Index absorbs data from a few parameters, which show the behavior of the investor.
Price Momentum: This is a key indicator that measures the performance of the top 10 coins by market capitalization, excluding the stablecoins. Not only does it compare the 10 coins among themselves, but it also compares them against the broader market.
If there is a coin that is performing much better than all the other tokens, it shows that traders fancy that coin. However, if the increase in the price of that token is because of the broader bullish trend, then it could also be found.
Volatility: Volmex Implied Volatility Indices (VIV) measure the volatility, or the tendency for the price to change. (BVIV and EVIV) for Bitcoin (BTC) and Ethereum (ETH) are the two versions of the VIV, which predicts the expected volatility within the next 30 days. High values on the VIV indicator show that the market is expecting huge swings, while small values show smaller divergence.

Derivatives Market: The Fear and Greed Index takes into account what’s happening in the derivatives market. In particular, the put-to-call ratio. When the put-to-call ratio is high, it means that many are buying puts, expecting the market to lose value. In this case the Fear and Greed Index usually shows Fear.
Market Composition: This market composition component focuses on Bitcoin’s value against the stablecoins. Specifically, it captures Bitcoin’s relative value compared to stablecoins, using the Stablecoin Supply Ratio (SSR) as the key metric. The SSR measures how large Bitcoin’s market capitalization is relative to the total supply of major stablecoins.
CMC Proprietary Data: This metric absorbs the user engagement, the social media trends, and the retail interest.
After capturing all the above-mentioned data and processing it, the Fear and Greed Index reflects on the overall market sentiment.
How can the Fear and Greed Index be used?
For market analysis: If the Fear and Greed Index shows high values, which are more than 80, then the market is in an extreme greed state. It means the market is overheating and will be due for a correction shortly.
Contrarian strategy: This is a strategy that goes against herd behavior, where a person does the opposite of what the others are doing. When the indicator reads “extreme greed,” it means that the market is on a buying frenzy. However, a person who follows a contrarian strategy would sell the token, expecting a correction as the market overheats.
Combination analysis: This is analysis where a trader uses a combination of indicators to detect the market condition. A complementary analysis is important, as each different indicator gives various insights about different parameters, and when these are put into context, one could get a better understanding about the market.
In simple terms, the Fear and Greed Index gauges the overall sentiment of the market by fetching data from different indicators that show the behavior of the traders or investors.