



An analyst who observed the price action of SEI mentioned that there is no chance of SEI returning to its all-time high above $1. To explain the impossibility of SEI reaching this level, the analyst looked at it from a technical perspective, on-chain side, and supply chain.
A crypto market analyst who goes by the pseudonym “Crypto Talks” posted on X that the chances of the SEI token reaching a new all-time high above $1 are quite slim. To better explain the projected thesis, the analyst looked at it from a few different angles.
Back in March 2024, $SEI hit its all-time high price of $1.14, and during this time, the circulating supply was roughly around 2.7 to 3 billion tokens. And relative to the circulating supply, the market cap was somewhere close to $2.2 to $2.5 billion.
However, come January 2025, the market cap climbed even higher and reached above $2.5 billion with the ongoing broader altcoin rally during that time. On a logical level this should mean that the price of the token should have appreciated above the all-time high. But it was not the case; instead, SEI was trading at $0.63.
Market cap rises as token supply increases while price stagnates
So the question is, when the price has not moved significantly, how can the market cap move?
Well, the market cap is the price of one token multiplied by the circulating supply. This means that if the price of a token did not increase, the supply should have increased. The circulating supply increased to somewhere between 3 and 5 billion. Although new money was entering the market, the tokens were flooding it faster. As such, the price of the token could not show a significant improvement.
Frequent token unlocks will not allow SEI to reach $1
The token unlock will further reduce the chance of the token reaching its previous all-time high. As of today there are about 6.37 billion SEI tokens circulating in the market, about 67% of the total supply of 10 billion tokens. If SEI reaches $1 per token, then the circulating market cap will hit 6.7 billion. However, currently the market cap is $354 million, and to reach $6.7 billion, the price of the token needs to appreciate close to 20x from here. And that is very unlikely.
As per the April 15, 2026 unlock alone, there will be another $55.56 million SEI that will be released to the team allocation. And SEI has been scheduled to unlock 1.5 to 2% of circulating supply every single month. As such, even in the event the token musters the strength to reach a price close to $1, the token supply by that would have reached 7.5 to 8 billion tokens.
The total value locked on SEI crashed by 95%
In mid-2025, $SEI TVL increased to $600 to $680 million, with the help of an incentive program. However, in April 2026, the TVL had crashed by nearly 95%, to $60 million.
Additionally, the daily chain fees are about $368 per day, which says that the traders are hardly using the network for transacting. This Layer 1 blockchain raised $95 million from investors including Jump Crypto, OKX Ventures, and Multicoin Capital, and now the DEX volume hovers around $9 to $10 million daily.
On top of that, the stablecoin market cap sits at $181 million, but native liquidity is only $118 million. The rest are bridged assets looking for an exit.
The relationship between Sei’s stablecoin market cap and its native liquidity reveals a deeper structural weakness within the network. While the total stablecoin market cap sits at $181 million, only $118 million of that is native, meaning a significant portion—around $63 million—consists of bridged assets. This distinction is critical because native liquidity reflects capital that is organically rooted within the ecosystem, whereas bridged liquidity is external, often temporary, and far less committed. In essence, a large share of the capital on Sei has not originated from genuine user adoption or long-term participation, but has instead been imported from other chains, typically in search of short-term opportunities.
This type of liquidity is inherently unstable. Bridged capital tends to be highly opportunistic, flowing into ecosystems that offer attractive yields, incentives, or speculative upside, and exiting just as quickly when those conditions change. It does not represent sticky demand or deep conviction in the network’s fundamentals. As a result, the presence of a large proportion of bridged assets suggests that Sei’s apparent liquidity may be overstated, as much of it is not structurally anchored within the ecosystem. Instead, it behaves more like transient capital that is constantly evaluating exit conditions.
The phrase “looking for an exit” becomes particularly relevant in this context. That $63 million in bridged liquidity effectively acts as latent sell pressure, meaning it has the potential to leave the system rapidly if market sentiment shifts or if more attractive opportunities arise elsewhere.
This creates an overhang on price action, as any upside movement may be met with distribution from participants who are not committed long term. At the same time, the relatively lower level of native liquidity indicates that the ecosystem may lack the internal strength needed to absorb these outflows.
Structurally, this imbalance points to a network that is still heavily reliant on external capital rather than sustained organic growth. It suggests that user activity and liquidity are likely being driven more by incentives than by genuine demand for the network’s applications or infrastructure.
In such an environment, stability becomes fragile, as the system depends on continued inflows to maintain its appearance of health. When those inflows slow or reverse, the lack of deep, native liquidity can lead to accelerated downside, as there are fewer committed participants to support the market.
From a standpoint, Seis’s failure to regain its 50-day moving average since October 2025 indicates that the market is still structurally weak. Many think the 50-day moving average is an indicator of trends. It often acts as a line that separates the terms “bullish” and “bearish” conditions. If the price stays below this level for a time, it means sellers are in control. Any rallies that occur are more likely to be corrections than the start of a long-term uptrend. SEIS’s inability to break above the 50-day MA for a time shows weak demand and a lack of sustained buying pressure.
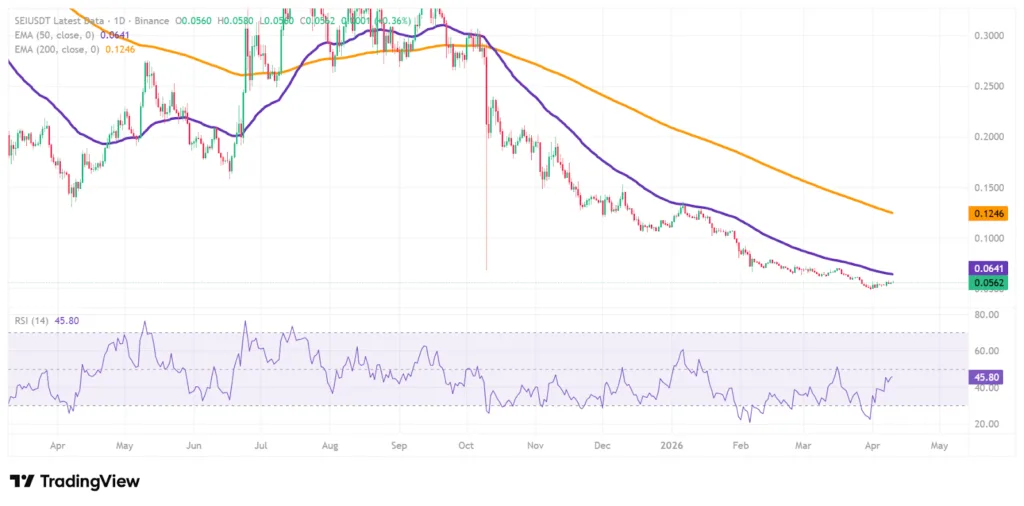
During this period buyers have tried times to break through this resistance. They have pushed the price toward the 50-day MA times. However, every time they try, they are turned down. This makes the level even stronger as a supply zone. These repeated failures aren’t technical issues; they reveal market sentiment. Every time the price gets close to the moving average, people who bought at levels may sell at breakeven or with smaller losses. This adds to the selling pressure. At the time, new buyers seemed hesitant to jump in fully. This is likely due to the downtrend and the lack of bullish confirmation. This creates a cycle where rallies lose steam as they approach resistance leading to rejection.
The lack of conviction is crucial. Markets often reclaim key levels like the 50-day MA with momentum. This is shown by rising volume and follow-through buying. SEI’s price action, on the other hand, suggests that these moves toward resistance are more likely short-term positioning or relief rallies than real accumulation. The price can’t break through the supply concentrated around the moving average without demand. Therefore, the 50-day MA remains a resistance level that keeps prices from rising and strengthens the bearish structure.
At the time the relative strength index (RSI) shows growing bullish momentum. An increase in the RSI means buying pressure is growing, at least in the short term, and momentum is starting to shift. However, just having momentum isn’t enough to change the market structure. During bear market rallies or consolidation periods, RSI can rise significantly, making it seem like the market is strong. It doesn’t actually break out. The key question for Sei is whether this momentum can lead to a reclaim of the 50-day MA backed by volume and continued follow-through.
The larger trend will remain the same until that happens. The fact that the 50-day MA keeps getting rejected shows that sellers are still in charge. The market doesn’t have the strength to change direction. Even if the price gets close to that level again, momentum traders will likely still be cautious due to past failures. If the price breaks above the 50-day moving average, it could signal a change in structure and mood. If it doesn’t, the current setup suggests that the market will stay weak. Rallies are likely to be sold into or built on.