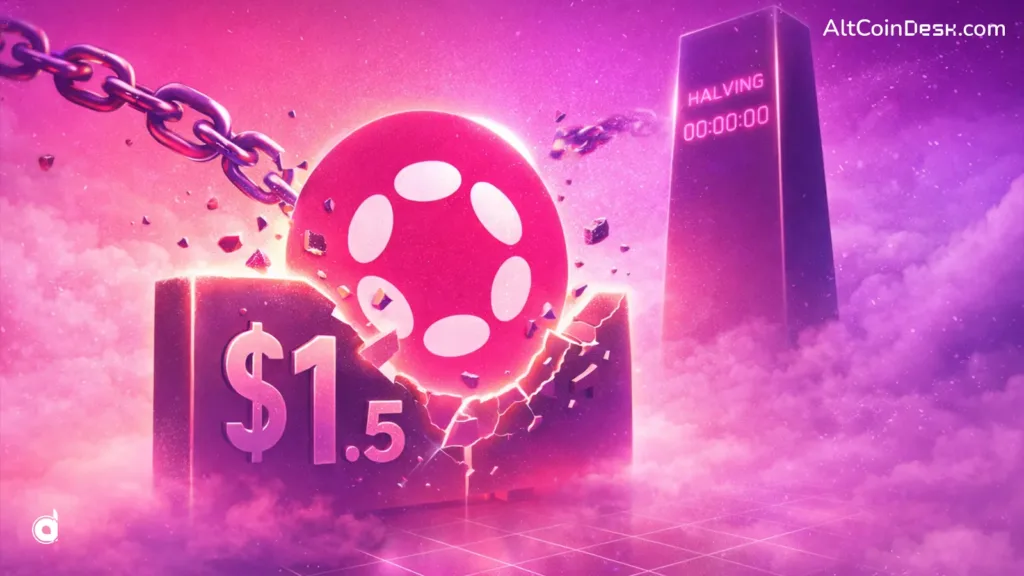
Polkadot (DOT) once again rose above the $1.5 psychological level, ending a macro downtrend that lasted for more than 14 months. The upcoming halving and the potential launch of an exchange-traded fund (ETF) are the catalysts behind ending DOT’s macro downtrend.
DOT prices once again recovered above the psychological $1.5 resistance level, bringing the 14-month-long downward trend to an end. The main event on Polkadot’s calendar is the upcoming halving, which is scheduled for March 14, 2026. During this first-ever halving event, Polkadot will slash annual token issuance by over 50%, establishing its shift to a deflationary model.
DOT halving event hype spikes prices
During a halving event, block rewards are cut in half, reducing the rate of new supply entering the market. While this does not directly increase demand, the reduced issuance can create supply pressure if demand remains steady or grows, potentially supporting higher prices over time.
It’s not just the halving event that’s behind the rising DOT prices, but the hype behind the launch of the DOT ETF is also driving the prices higher. Asset management firm Grayscale applied for S-1 registration forms with the Securities and Exchange Commission to launch a DOT ETF.

As shown in the chart above, the DOT prices have started to recover, and it is currently testing the 50-day Moving Average (MA), which is a good sign. In fact, the 14-month-long downward trend seems to have come to an end as DOT has once again risen above the $1.5 resistance level.
DOT will reach above $2 after breaking out

As shown in the chart above, DOT is trading inside a bullish falling wedge. Going by technical terms, the token should reach the upper trendline, which is above $1.7, as it follows the falling wedge pattern. And once the pattern is complete, the token will break out and reach values above $2.
The Relative Strength Index indicator (RSI) is showing a bullish divergence. When DOT is making lower lows, the RSI is printing higher lows. This shows that the bullish momentum is building behind the scene, although it is not visible on the chart.