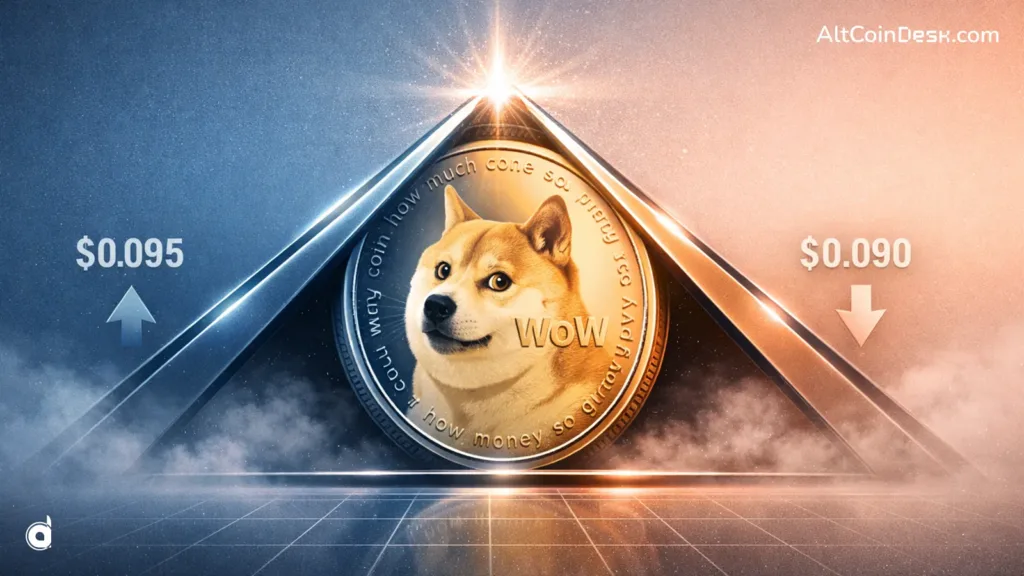

Dogecoin (DOGE) has currently been rejected at the $0.094 resistance level as it consolidates inside the symmetrical triangle pattern. With Dogecoin trading between two important levels, support at $0.090 and resistance at $0.094, the DOGE community expects price appreciation in the coming days.
How Dogecoin came into existence
Initiated as a joke coin, Dogecoin is a cryptocurrency whose roots trace back to its humorous nature in relation to the beginning of the era of cryptocurrencies, where it was developed as a parody of the crypto revolution. The idea for naming it came from the “doge” meme, which became popular on the internet and showcased a Shiba Inu dog.
The project was developed by Billy Markus and Jackson Palmer in 2013 when their intention was to create a cryptocurrency that would be a satire on the speculative hype around blockchain-related projects. However, the founders no longer work on the project, leaving it in the hands of external developers and the Dogecoin Foundation.
Currently, Dogecoin has moved beyond the initial phase and has found various uses related to online interactions, such as tips and online micropayments. In addition, the coin has also become a part of pop culture because of celebrity endorsements.
As the project keeps growing and the memecoin becomes famous, its price has been consolidating for the past few weeks. As shown in the chart below, DOGE’s price has been consolidating inside a tight price range. The support level at $0.90 and the resistance level at $0.95 have been impenetrable since the last week of the last month.

A consolidation stage implies that, following an impulsive price move, the DOGE coin market stops trading within a limited range since buyers and sellers find themselves in a situation of balance as a result of a temporary correction of the market.
What happens during consolidation phase?
This period means that the price will not trend but go sideways, forming a consolidation pattern with defined support and resistance levels. This is explained by the fact that early investors begin to cash in their earnings while others hesitate to enter the market due to fear of unfavorable conditions.
Market-wise, a consolidation period functions as a reset one because it gives a chance for technical indicators such as the RSI to calm down, eliminates leverage, and accumulates liquidity. Trading volume falls; price action is characterized by sharp movements, which may cause some false breakouts that may catch both bulls and bears off guard.
In addition, consolidation is a preparatory phase that does not indicate any weakness in the market. The wider the consolidation pattern, the higher the probability of the price making a strong move in the future.
As DOGE moves between these two levels, the crypto community is having mixed emotions about what might happen to the prices. A crypto expert who goes by the pseudonym Waziri stated how lucrative it would be to invest in Dogecoin.

Technical analyst who goes by the pseudonym Trader Tardigrade observed a bullish setup that DOGE has been following since 2016. When the relative strength index indicator bottoms as the prices reach their local bottoms, there is a bullish rally that follows this setup. With DOGE establishing another low, the analyst expects it to reciprocate this price action.
The daily chart above shows that Dogecoin is trading inside a symmetrical triangle pattern. As the memecoin is currently forming the apex of the triangle, a breakout could happen at any given time.
DOGE consolidates inside symmetrical triangle

Inside a symmetrical triangle pattern, the price action enters a phase of consolidation and growing indecision between buyers and sellers.
It should be noted that neither buyers nor sellers are in a dominant position in the structure, which means that buyers begin to actively enter at dips, while sellers become increasingly active at rallies. In such a situation, the market gradually becomes quieter, and price fluctuations tend to be less than before.
The symmetrical pattern starts to form when the price begins to oscillate in a constantly tightening range. Then, when the points of the lower lows and higher lows are connected, the converging triangle takes shape. As the pattern evolves, there will be less and less volatility on the chart. Price swings decrease in size until the lines cross.
At the same time, the price begins to oscillate more tightly and coil. There is no clear dominance of either bulls or bears in this situation, which is why a temporary equilibrium forms between the parties, storing potential energy.
This takes place usually when traders expect something important to happen, and no one is ready to step in and take a decision. The trading volume of the token on the chart tends to gradually decrease until the breakout happens.
The price is consolidating inside a symmetrical triangle pattern as traders are waiting for a breach of either the resistance or the support level ($0.090 or $0.095). With the memecoin now forming the apex of the symmetrical triangle, it could break out in any direction. It could be up or down. A symmetrical triangle breakout can move either upward or downward, as the pattern itself is neutral and does not predict direction.
Although there is no clear direction for the breakout, studies show that if the pattern was formed during the broader market uptrend, there is a high chance that the trend may continue once the pattern is broken, and the same applies if the market is bearish.
Traders may need to watch out for price action that happens outside of the range between $0.090 and $0.095. Once the memecoin manages to cross above or below one of these levels, it usually means that the breakout has happened.
Even the relative strength index indicator, which signals if the price of the memecoin is overvalued or undervalued, does not give a clue of any extreme condition. This makes it even harder to adjudicate the market and the breakout.
It gets even harder as false breakouts are also quite common in symmetrical triangles, where price briefly breaks out in one direction only to reverse quickly and trap traders who entered too early.
In the end, the pattern reflects a period of indecision and tightening price action, and the real direction only becomes clear once strong momentum and volume step in to confirm the move. As such, traders may need to practice precaution.