



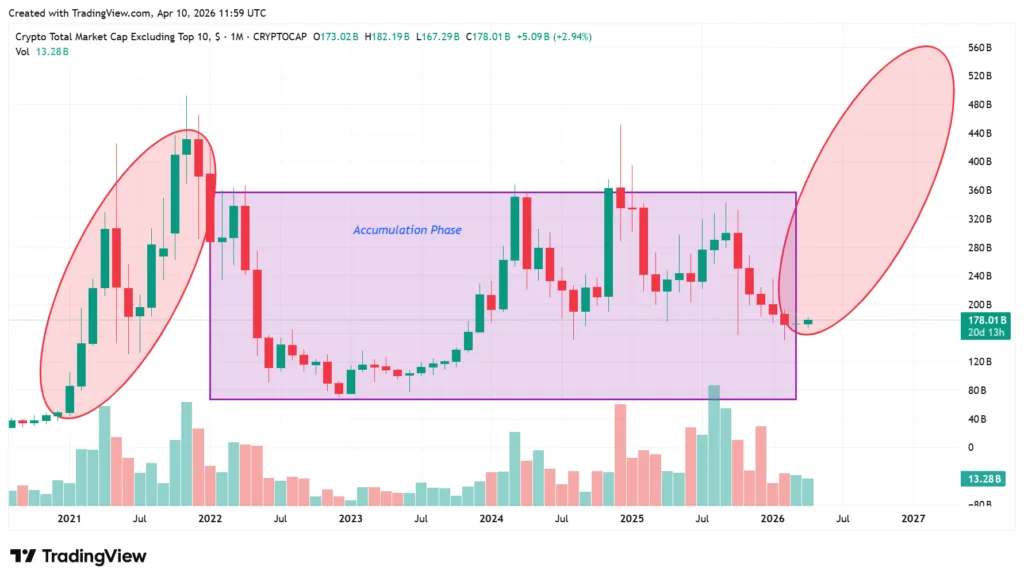
The altcoin market cap, except for the top 10, has been accumulating for the past 5 years, and based on historic data, there could be a rise in the prices.
Many have been anticipating the altcoin season for quite some time now, and it has not materialized as of yet. The chart below shows the total market cap excluding the top 10 crypto assets. Since the rally that happened back in 2021, the altcoins have been in an accumulating phase for almost 4 years. And now that the market cap has bottomed, the setup looks like there is going to be a rally.
Is the altcoin season really going to happen?
According to the altcoin season index indicator, which fluctuates between 0 and 100, the current season is neutral. Reading a value of 41 on its scale, the altcoin season index indicator says it is neither an altcoin nor a bitcoin season.
The Altcoin Season Index (ASI), which is commonly monitored by Blockchaincenter.net, determines whether the altcoins are beating Bitcoin by looking into the performance of the top 50 cryptocurrencies (without stablecoins) within a moving window period of 90 days.
The ASI evaluates how many coins beat Bitcoin based on their performance using the majority rule approach, with 75% or higher beating BTC indicating altcoin season and vice versa.
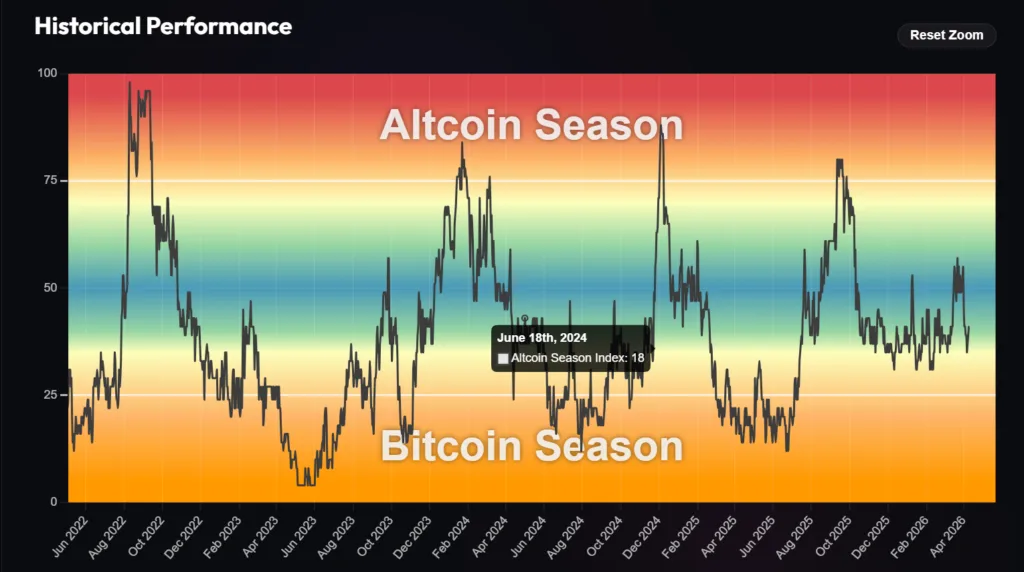
Since the index only takes into account price action relative to the base asset, the index becomes a reliable tool for measuring capital flows, which indicates whether capital flows into the cryptocurrency with more liquidity, namely Bitcoin, or flows out and starts moving into riskier altcoins.
While the index indicates a neutral value, when taking into account all other circumstances, the Alt Season Indicator becomes positive and accumulates momentum. This occurs prior to the upward movement in the ASI index.
The third signal for an alt season is Bitcoin dominance, which measures the percentage of Bitcoin from the total market capitalization of all cryptocurrencies. Bitcoin dominance serves as an important metric to determine whether capital is flowing into Bitcoin or not.
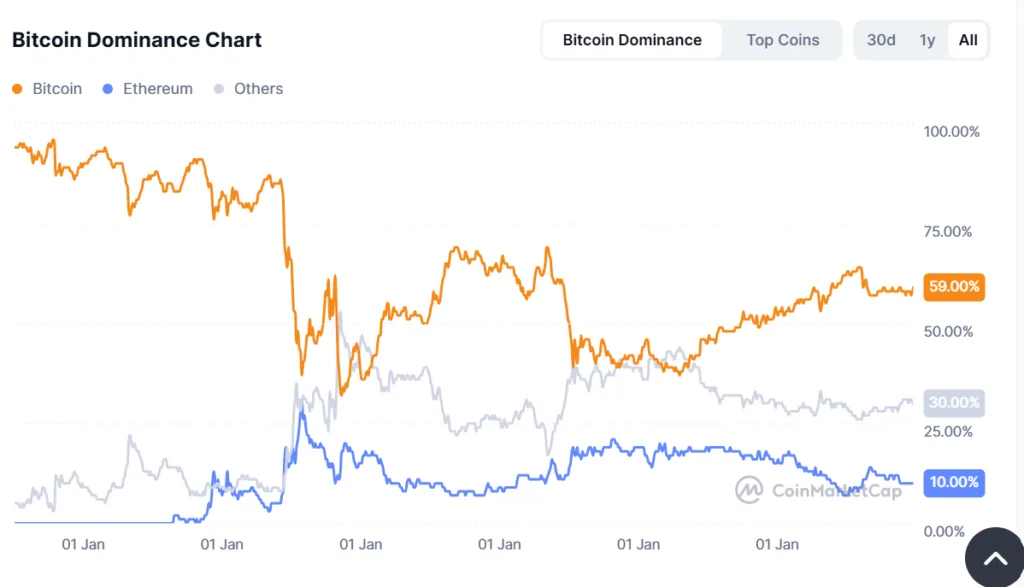
It drops when there is a rotation of capital towards altcoins, and this usually occurs when the speculation level of the crypto markets is high. The index does not track the direction of price movements; it measures relative strength to identify market dynamics.
Looking at the chart above, the Bitcoin dominance has lost its upward trend. Currently, Bitcoin dominance is 59% after losing the upward trend. This shift is a major development in the case of altcoin season.
In addition to that, the US liquidity charts show a massive spike, and the last time this happened, the market was bottoming in 2022. An analyst stated on X, “We also have this happening at the same time as PMI is in expansion… This is another one of the macro pieces that is not happening by coincidence, guys.”
The Purchasing Managers’ Index is a leading economic indicator that tracks business activity by surveying purchasing managers on key areas like orders, production, and employment. It operates as a diffusion index, where readings above 50 indicate expansion and below 50 signal contraction, making it a simple gauge of economic momentum.
Because it reflects real-time business conditions, PMI often leads broader economic trends and influences market expectations around growth and monetary policy, which in turn impacts liquidity and risk assets like crypto. So the bottom line is that, with the altcoin market cap accumulating for more than 4 years, bitcoin dominance falling, and US liquidity about to expand, there is a high chance that the altcoin season will materialize very quickly.
Even the one day chart as shown in the figure below shows that the altcoin market cap excluding Bitcoin is trading inside an ascending triangle. An ascending triangle is a bullish continuation pattern that forms when the price keeps testing a horizontal resistance level and making higher lows. This means that buyers are getting more aggressive. The flat resistance is a place where sellers are always coming in to sell their goods.
The rising trendline below the price shows that buyers are willing to buy at higher and higher levels, which over time makes the distance between support and resistance shorter. This makes the volatility slowly shrink and the price get pushed into a smaller range. This shows a change in control, where demand is slowly taking over supply at the resistance level.
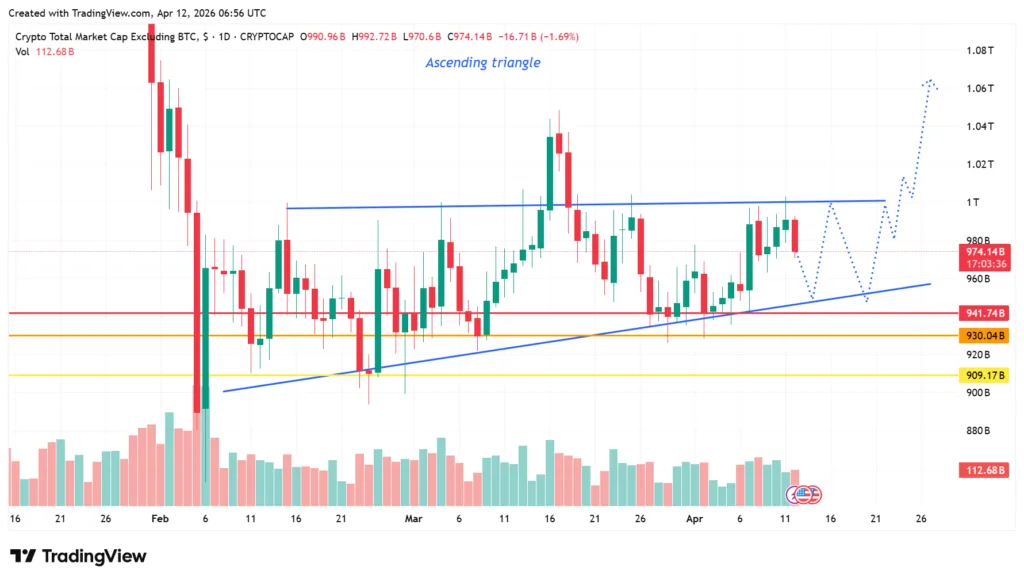
As the structure changes, the way traders act inside the pattern changes as well. In the beginning, the market is pretty balanced, with buyers buying on dips and sellers defending resistance. This makes prices move more widely. As the pattern develops, buyers start to act quickly and step in earlier on each pullback, which causes higher lows to form.
This change in behavior shows that bulls are becoming more sure of themselves, while sellers still use the same resistance level to keep prices down. During this time, the market becomes less volatile, and traders start to see the pattern and expect a breakout.
Breakout traders set up their trades by placing buy orders just above resistance. Short sellers, on the other hand, often place stop losses just above the same level, which creates a pool of liquidity without them meaning to.
As the price gets closer to the top of the triangle, the range gets even smaller and the market gets more and more coiled. At this point, positioning gets crowded because both breakout traders and trapped shorts add to the number of orders above resistance.
When the price finally breaks through the level, it often sets off a chain reaction of buying, as stop losses are hit and momentum traders enter the market. This causes the price to rise very quickly. But the pattern isn’t always right. If the breakout fails and the price goes back below resistance, it can trap long positions and cause a reversal. This is because the same liquidity that caused the breakout now speeds up the move in the opposite direction. As such traders may need to practise precaution.